

How garbage collection works
How the JVM decides what is garbage and reclaims it: GC roots and reachability, mark, sweep, compact and copy, stop-the-world pauses and safepoints, and the HotSpot collectors from Serial to ZGC with their defaults and trade-offs.
On this page
🧹 What is garbage collection?
Garbage collection (GC) is the JVM finding heap objects that your program can no longer reach and reusing their memory, so you never call free or delete. A busy service might run new OrderEvent(...) 50,000 times a second; a collector later works out which of those events nothing can reach any more and hands their bytes back to the allocator. It acts like the cleaning crew in a cinema: you never clear your own seat, and the crew only clears seats that nobody is sitting in.
For this lesson, we'll build the mental model every HotSpot collector shares: roots and reachability, mark, sweep, compact and copy, stop-the-world pauses, and then the collectors and their trade-offs. Interviewers love this question because it's a ladder. A junior answer stops at "it deletes unused objects"; a senior answer explains how "unused" is decided and what it costs your application.
Below the line (out of scope)
- Eden, survivor spaces, aging and promotion: Generational collection
- What lives on the stack and what lives on the heap: Stack vs heap
- Soft, weak and phantom references and how the GC treats them: Strong, soft, weak and phantom references
- Class metadata and class unloading: Metaspace: where classes live
- G1 internals and reading production GC logs: Java memory management: heap, G1 and the signals that matter
The 30-second answer
The JVM decides what is garbage by reachability, not by counting references. It starts from the GC roots (local variables in the frames of live threads, static fields, JNI references and a few JVM-internal handles), follows every reference and marks what it reaches. Anything left unmarked is garbage, including cycles of objects that only point at each other. The collector then reclaims space by sweeping dead chunks into a free list, by compacting live objects together, or by copying live objects into an empty area. Some of that work needs a stop-the-world pause, where Java threads halt at a safepoint. HotSpot ships Serial, Parallel, G1 (the default since Java 9), ZGC and Shenandoah; CMS was removed in Java 14. Each one trades throughput, pause latency and memory footprint differently, and System.gc() is only a request.
What you’ll learn
- Explain reachability from GC roots and why an unreachable cycle is collected
- Describe the mark phase correctly: it marks live objects, and its cost follows the live set
- Compare sweep, compact and copy, and draw why sweeping alone fragments the heap
- Explain stop-the-world pauses and safepoints, and why
System.gc()is only a hint - Compare Serial, Parallel, CMS, G1, ZGC and Shenandoah, and name the default collector per Java version
- Reason about throughput vs latency vs footprint, and check your collector with
-XX:+PrintCommandLineFlagsand-Xlog:gc
Interview radar
Asked very often: How does the JVM know an object is garbage? What happens to two objects that reference each other? Core follow-up: What does stop-the-world mean, and why would a collector bother moving objects? Production angle: Which collector is your service running right now, and how would you prove it?
01Picture it first: roots, a graph and everything else
Picture the heap as a city of houses joined by one-way roads, where each road is a reference field. The GC roots are the city gates. Any house you can drive to from a gate is occupied. A house with no route from any gate is abandoned, even if two abandoned houses have roads leading to each other.
Here's that city as a graph. The violet objects are reachable from a root; the orange pair forms a cycle with no path from any root.
GC roots on the left point into a graph of reachable heap objects, while two orange objects that reference each other have no path from any root and are therefore garbage
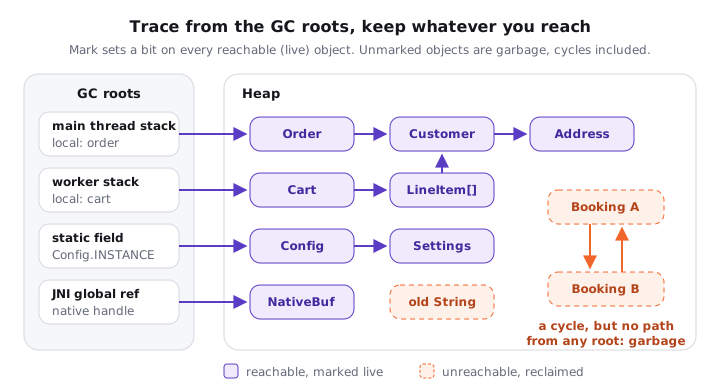
The roots are the starting points the JVM already knows about without looking inside the heap:
- Thread stacks. Local variables and operand-stack slots in every frame of every live thread.
- Static fields of loaded classes. Since JDK 8 they live in the heap next to the class's
java.lang.Classobject, which stays reachable through its class loader. - JNI references held by native code, plus objects used as locks by threads that currently hold them.
- JVM internals such as the system class loader and other handles the VM keeps for itself.
The Java Language Specification phrases the rule as reachability: an object is reachable if "any potential continuing computation from any live thread" can access it (JLS §12.6.1). The JVM specification deliberately doesn't pick an algorithm (JVMS §2.5.3), but every HotSpot collector is a tracing collector built on this idea.
Why not count references, the way CPython does? Counting can't free a cycle by itself, because each object keeps the other's count at 1, and every reference assignment would have to update counters atomically on hot paths. Tracing pays in batches instead, and only for objects that are still alive.
02Under the hood: mark, then sweep, compact or copy
Try it yourself first
Before reading on, predict the output. Two bookings point at each other, then both local variables are set to null. Does the cycle survive a collection? Now predict again with -XX:+DisableExplicitGC.
import java.lang.ref.WeakReference;

public class BookingCycle {
    static final class Booking {
        Booking linked;
        final byte[] seatMap = new byte[1024 * 1024]; // 1 MB, easy to spot in the log
    }

    public static void main(String[] args) throws InterruptedException {
        Booking outbound = new Booking();
        Booking ret = new Booking();
        outbound.linked = ret;            // A -> B
        ret.linked = outbound;            // B -> A: a cycle

        WeakReference<Booking> probe = new WeakReference<>(outbound);

        outbound = null;                  // drop both roots
        ret = null;

        System.gc();                      // a request, not a command
        Thread.sleep(100);

        System.out.println("cycle collected? " + (probe.get() == null));
    }
}
Here's what I got on JDK 21 (G1, 14-core laptop):
$ java -Xlog:gc BookingCycle
[0.005s][info][gc] Using G1
[0.025s][info][gc] GC(0) Pause Full (System.gc()) 5M->1M(56M) 2.663ms
cycle collected? true

$ java -XX:+DisableExplicitGC BookingCycle
cycle collected? false
Notice four things:
- The two bookings still referenced each other, and both were collected. Reachability from roots decides, not reference counts.
- The
WeakReferenceis only a probe: it lets us ask "is it gone?" without keeping the object alive. The references lesson covers why. - On G1,
System.gc()triggeredPause Full (System.gc()): a full, stop-the-world collection of the whole heap, which took 2.7 ms on this tiny heap. - With
-XX:+DisableExplicitGC, the JVM ignored the call, no collection ran in time, and the cycle was still there. TheRuntime.gc()Javadoc says the call "suggests" effort and gives "no guarantee" of reclaiming anything.
Phase 1: mark the live objects
Many tutorials say the mark phase "marks the objects with no references". It's the other way round. The collector starts at the roots, pushes them onto a work list, and repeatedly pops an object, sets its mark bit and pushes every object it references that isn't marked yet. When the list is empty, every marked object is live and every unmarked object is garbage.
The cost of marking grows with the number of live objects and references, not with the size of the heap. A dead object is never visited at all. Hold onto that: it's why young-generation collections are cheap, which the next lesson builds on.
Phase 2: reclaim the space, three ways
Once the collector knows what's live, it has three ways to turn the rest into usable memory. This figure shows the same 10-slot stretch of heap under each one.
The same heap strip after mark: sweep leaves three separate gaps that cannot fit a 3-slot object, compaction slides live objects left to make one free block, and copying evacuates live objects into an empty space so the whole source becomes free
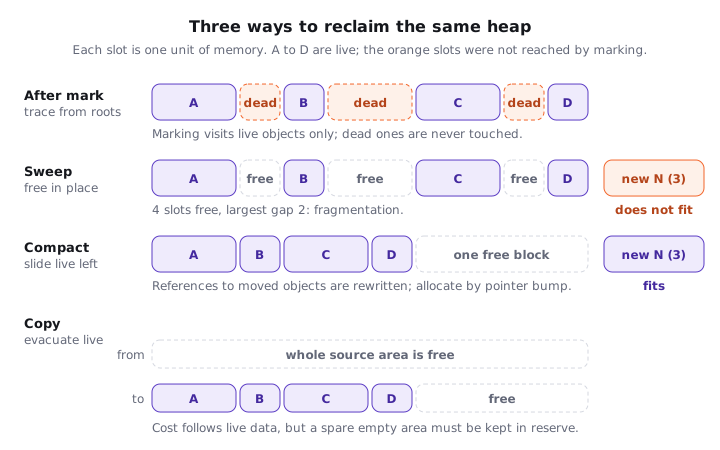
- Sweep. Walk the heap and link every dead chunk into a free list. Nothing moves, so it's quick and safe to do alongside running code. The catch is fragmentation: three free gaps of 16 KB add up to 48 KB, yet a 32 KB array fits in none of them. Allocation also gets slower, because it has to search the free list for a gap big enough.
- Compact. After marking, slide the live objects towards one end and rewrite every reference to the moved objects. You end up with one contiguous free block, so allocation is a pointer bump again. The price is extra passes over the heap and moving data while nothing else can touch it.
- Copy (evacuate). Copy each live object into an empty area as you find it, then treat the whole source area as free. The cost depends only on live data, and the result is already compact. The price is that you must keep an empty area in reserve to copy into. Young generations and G1's regions work this way.
You'll often hear "mark-sweep-compact" as one phrase. Serial and Parallel run it on the old generation during a full collection. G1 and ZGC mostly copy, region by region, and fall back to an in-place compaction only in emergencies.
Stop-the-world and safepoints
Here's the catch with moving objects. If the collector copies an Order to a new address while your thread is reading it through the old one, your thread reads garbage. So for the steps that can't overlap with your code, the JVM stops the world: every Java thread pauses until the step finishes.
Threads stop at a safepoint, a point where the JVM knows exactly which stack slots and registers hold references and the heap is consistent. Compiled code polls for a pending safepoint at method returns and loop back-edges. Threads running native JNI code can keep going, because they only touch the heap through handles and block if they try during the pause.
So the pause you feel is time to reach the safepoint plus the GC work done inside it. Concurrent collectors (G1's marking, ZGC, Shenandoah) do most of their work while your threads run, using read or write barriers to keep the picture consistent. They still have short pauses. Serial, Parallel and G1 also stop the world for every young collection, not only for full ones.
System.gc() is a hint, so treat it like one
What System.gc() does depends on the collector and flags: G1 runs a full stop-the-world collection by default, -XX:+ExplicitGCInvokesConcurrent makes G1 start a concurrent cycle instead, and -XX:+DisableExplicitGC ignores the call. I don't call it in production code. If a library does, the GC log shows (System.gc()) as the cause.
How to see which collector you're running
The JVM picks a collector at startup (ergonomics), so check before you reason about pauses:
$ java -XX:+PrintCommandLineFlags -version
-XX:ConcGCThreads=3 -XX:G1ConcRefinementThreads=11 -XX:InitialHeapSize=805306368
-XX:MaxHeapSize=12884901888 ... -XX:+UseCompressedOops -XX:+UseG1GC
openjdk version "21.0.12" 2026-07-21

$ java -XX:ActiveProcessorCount=1 -XX:+PrintCommandLineFlags -version
... -XX:+UseSerialGC

$ java -Xlog:gc -jar orders-service.jar
[0.005s][info][gc] Using G1

$ jcmd <pid> VM.flags | tr ' ' '\n' | grep Use.*GC
-XX:+UseG1GC
On this 48 GB machine, the default maximum heap is 12 GB (one quarter of physical memory) and the initial heap is 768 MB (1/64). Telling the JVM it has one CPU flipped the choice to Serial. From inside the process, the garbage collector MXBeans tell you the same thing:
for (GarbageCollectorMXBean gc : ManagementFactory.getGarbageCollectorMXBeans()) {
    System.out.printf("%-22s collections=%d time=%dms%n",
            gc.getName(), gc.getCollectionCount(), gc.getCollectionTime());
}
// G1:       "G1 Young Generation", "G1 Concurrent GC", "G1 Old Generation"
// Parallel: "PS Scavenge", "PS MarkSweep"
// Serial:   "Copy", "MarkSweepCompact"
The Serial bean names give the algorithms away: young collections copy, old collections mark, sweep and compact.
03Real world: the collector you didn't choose
One of the most common surprises I see is a service that's quietly running Serial GC in production. A team moves a JDK 17 or 21 service into Kubernetes with cpu: 1 and memory: 1Gi. The JVM sees one CPU, decides the machine isn't "server-class" (Java 21 needs at least 2 CPUs and at least 1792 MB), picks Serial, and caps the heap at 256 MB. Under load, every young collection is single-threaded and p99 latency jumps. Nobody chose Serial; nobody checked. The fix is boring: print the flags on startup, set the collector explicitly (-XX:+UseG1GC), and size the heap with -XX:MaxRAMPercentage instead of trusting defaults.
GC trouble rarely looks like "GC is slow". It looks like latency spikes that line up with Pause Full lines, or a heap that's still 90% full right after a collection. That last one is a leak or an undersized heap: no collector can free memory that's still reachable.
04Advanced: the HotSpot collectors
Every collector below uses the same building blocks: trace from roots, then sweep, compact or copy. They differ in how many threads do the work and how much of it overlaps with your application. Here's how a pause looks on a timeline for four of them.
Timelines of application threads for Serial, Parallel, G1 and ZGC: Serial has one long single-threaded pause, Parallel a shorter multi-threaded pause, G1 short pauses with concurrent marking between them, and ZGC tiny pauses with almost all work concurrent
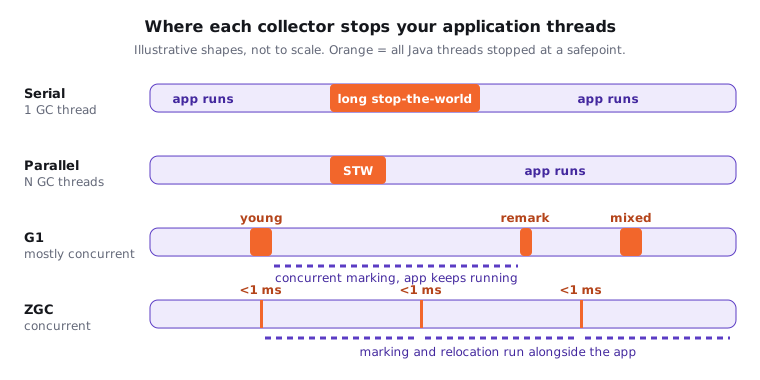
Serial does everything on one GC thread with the world stopped. With no coordination overhead, it's efficient on one CPU or for heaps up to about 100 MB, which is why ergonomics still picks it on small machines.
Parallel, the "throughput collector", has the same design and the same stop-the-world pauses, but many GC threads share the work, so each pause is shorter on a multi-core machine. It was the server default up to Java 8 and still suits batch jobs.
CMS, Concurrent Mark Sweep (history). CMS marked the old generation while the application ran, with two short stop-the-world pauses (initial mark and remark), and swept without compacting. Two problems followed: fragmentation, and "concurrent mode failure", where the old generation filled before CMS finished and the JVM fell back to a long stop-the-world collection. It was deprecated in Java 9 (JEP 291) and removed in Java 14 (JEP 363).
G1, Garbage-First, splits the heap into equal regions, marks the old generation concurrently, then evacuates the regions with the most garbage first, compacting as it copies. It aims for -XX:MaxGCPauseMillis, 200 ms by default. That's a goal, not a promise: every young and mixed collection is stop-the-world. It became the default in Java 9 (JEP 248).
ZGC marks and relocates objects concurrently using coloured pointers and load barriers, keeping pauses under a millisecond for heaps from a few hundred megabytes to 16 TB. It went to production in Java 15 (JEP 377) and gained a generational mode in Java 21 with -XX:+ZGenerational (JEP 439).
Shenandoah is another concurrent, compacting, low-pause collector, production since Java 15 (JEP 379). Not every vendor's build includes it, so check yours first.
Many candidates say "G1 and ZGC have no pauses" or "CMS never stopped the application". That's frequently a mistake that costs points, because it tells me they've only read the marketing line. CMS had initial-mark and remark pauses and could fall back to a full stop-the-world GC. G1 stops the world for every young and mixed collection and targets 200 ms by default. ZGC's pauses are tiny, but they exist. Say "mostly concurrent" and name the pauses.
| Collector | Flag | GC threads | Pauses | Compacts? | Best for | Status in Java 21 |
|---|---|---|---|---|---|---|
| Serial | -XX:+UseSerialGC |
1 | Stop-the-world, young and old | Yes (old gen) | 1 CPU, heaps under ~100 MB, tools | Default on small machines |
| Parallel | -XX:+UseParallelGC |
Many | Stop-the-world, shorter | Yes (old gen) | Batch, max throughput | Supported |
| CMS | -XX:+UseConcMarkSweepGC |
Many | Short initial mark and remark | No | Historical low-pause | Removed in Java 14 |
| G1 | -XX:+UseG1GC |
Many | Short stop-the-world, 200 ms goal | Yes, by evacuating regions | General-purpose services | Default on server-class machines |
| ZGC | -XX:+UseZGC |
Many | Under 1 ms | Yes, concurrently | Large heaps, tight latency | Production; generational via -XX:+ZGenerational |
| Shenandoah | -XX:+UseShenandoahGC |
Many | Very short | Yes, concurrently | Low latency | Production, build-dependent |
And the defaults you'll be asked about, by version:
| Java version | Default on a server-class machine | Default otherwise |
|---|---|---|
| 8 | Parallel | Serial |
| 9 to 26 | G1 | Serial |
| 27 and later | G1 (JEP 523) | G1 |
"Server-class" in Java 21 means at least 2 processors and at least 1792 MB of memory; in Java 8 it was 2 processors and 2 GB. ZGC's generational mode became its default in Java 23 and the non-generational mode was removed in Java 24, but for a Java 21 service you still opt in with -XX:+ZGenerational.
One subtlety that impresses interviewers: an object can become unreachable before its variable goes out of scope, because JLS §12.6.1 lets the compiler treat a local that's never read again as dead.
05Throughput vs latency vs footprint
The Oracle GC tuning guide measures collectors on three axes, and you can't max out all three at once:
- Throughput: the share of total time not spent in GC, over a long run.
- Latency: how long individual pauses make requests wait.
- Footprint: how much memory (and CPU) the process needs.
Shorter pauses don't come free. Concurrent collectors run GC threads alongside your code and add barriers to reference reads or writes, so they spend more CPU and need more heap headroom. The claim "less pause time means more throughput and lower latency" is only half true: you usually buy latency with throughput or memory.
I ran a synthetic churn workload on JDK 21 (one application thread allocating 800 million 128-byte arrays and 12.5 million 1 KB arrays into a 400,000-slot long-lived table, 2 GB fixed heap, 14-core laptop) twice per collector, measuring GC safepoints with -Xlog:safepoint:
| Collector | Wall time | CPU time | Median pause | Longest pause | Total paused | |---|---|---|---|---|---| | Serial | 9.7 to 14.9 s | 10 to 12 s | 16 to 18 ms | 152 to 774 ms | 4.9 to 7.6 s | | Parallel | 7.7 to 8.6 s | 18 to 20 s | 5 to 7 ms | 45 to 62 ms | 1.8 to 1.9 s | | G1 | 9.7 to 11.0 s | 41 to 45 s | 27 to 29 ms | 41 to 49 ms | 3.5 to 3.8 s | | Generational ZGC | 6.8 to 8.4 s | 25 to 30 s | 0.05 to 0.07 ms | 12 to 13 ms | 0.19 to 0.23 s |
Read it as a shape, not a leaderboard. Serial used the least CPU but paused the longest. ZGC cut median pauses by more than 100x and kept pace with Parallel on wall time, but only because 13 idle cores absorbed its concurrent work: it burned 2 to 3 times Serial's CPU. Squeeze this into a one-CPU container and that concurrent work comes straight out of your request threads. This workload writes new objects into an old table at random, which is G1's least favourite pattern, so don't read G1's row as typical.
The default I recommend: stay on G1 until measurements say otherwise. Move to Parallel for batch jobs where only total runtime matters, and to Generational ZGC when p99 pause time is the metric you're paged for and you have spare cores and memory.
06How to say it in the interview
When I ask "how does garbage collection work?", I'm listening for three things: reachability from GC roots (and the cycle example), the difference between sweeping, compacting and copying, and an honest account of pauses, including that "concurrent" collectors still stop the world briefly. Strong candidates then name the default collector for their Java version and say how they'd check it.
In the interview
"The JVM finds garbage by tracing, not reference counting. It starts at the GC roots, meaning locals on live threads' stacks, static fields and JNI handles, and marks everything reachable. Whatever isn't marked is garbage, so an unreachable cycle gets collected. Then it reclaims space: sweeping is cheap but fragments, compacting slides live objects together, and copying evacuates live objects into empty space at a cost proportional to live data. Moving objects needs a stop-the-world pause at a safepoint. HotSpot has Serial, Parallel, G1 as the default since Java 9 with a 200 ms pause goal, and ZGC and Shenandoah for sub-millisecond pauses; CMS was removed in 14. They trade throughput, latency and footprint. System.gc is only a hint, and I'd confirm the collector with PrintCommandLineFlags or -Xlog:gc."
On the whiteboard
garbage = not reachable from GC roots
roots: thread stacks, static fields, JNI refs, VM internals
cycles with no root path -> collected (not ref counting)
mark: trace from roots, mark LIVE objects; cost ~ live set
reclaim: sweep (free list, fragments) | compact (slide) | copy (evacuate)
STW pause = time-to-safepoint + GC work
Serial 1 thread | Parallel N threads, throughput | CMS removed in 14
G1 default 9+, regions, MaxGCPauseMillis=200 (goal)
ZGC <1 ms, gen in 21 via -XX:+ZGenerational | Shenandoah
server-class: >= 2 CPUs and >= 1792 MB, else Serial (until JDK 27)
trade-off: throughput vs latency vs footprint
System.gc() = hint; -XX:+DisableExplicitGC
check: -XX:+PrintCommandLineFlags -version, -Xlog:gc
Interview questions for this topicComing soon
Further reading (18)
- HotSpot Virtual Machine Garbage Collection Tuning Guide, Java SE 21
- GC Tuning Guide (Java 21): Ergonomics and default selections
- GC Tuning Guide (Java 21): Available collectors
- GC Tuning Guide (Java 21): Garbage-First (G1) Garbage Collector
- Java SE 8 GC Tuning Guide: Concurrent Mark Sweep (CMS) Collector
- Java SE 8 GC Tuning Guide: Ergonomics (server-class machines)
- JLS §12.6.1: Implementing Finalization (reachability)
- JVMS §2.5.3: Heap
- Runtime.gc() (Java SE 21 API)
- The java command (Java SE 21): -XX:+DisableExplicitGC, -XX:+PrintCommandLineFlags, -Xlog
- HotSpot Glossary of Terms (safepoint, GC root, compaction)
- JEP 248: Make G1 the Default Garbage Collector
- JEP 291: Deprecate the Concurrent Mark Sweep (CMS) Garbage Collector
- JEP 363: Remove the Concurrent Mark Sweep (CMS) Garbage Collector
- JEP 377: ZGC: A Scalable Low-Latency Garbage Collector (Production)
- JEP 379: Shenandoah: A Low-Pause-Time Garbage Collector (Production)
- JEP 439: Generational ZGC
- JEP 523: Make G1 the Default Garbage Collector in All Environments