

Stack vs heap
Where Java data really lives: per-thread stacks of frames for locals and references, one shared heap for objects and the string pool, and the errors and flags that come with each.
On this page
🧱 What are the stack and the heap?
The JVM keeps your program's data in two main places. Every thread gets its own stack, a pile of frames where each running method keeps its local variables. All threads share one heap, where every object you create with new lives. If you write int qty = 3; Customer c = new Customer("Asha"); inside a method, qty and the reference c sit in that method's frame, while the Customer object itself sits on the heap.
For this lesson, we'll build the mental model you need for every memory question that follows: what goes in a frame, what goes on the heap, how frames come and go, and which error you get when each one runs out. Interviewers ask this early because it's the foundation for garbage collection, thread safety and memory leaks. If your picture of stack versus heap is fuzzy, every later answer wobbles.
Below the line (out of scope)
- How the collector finds and frees dead objects: How garbage collection works
- Young and old generations, Eden and survivor spaces: Generational collection
- Where classes and their metadata live: Metaspace: where classes live
- Weak, soft and phantom references: Strong, soft, weak and phantom references
- What a thread is in the first place: Processes vs threads
The 30-second answer
Each thread has its own JVM stack made of frames, one frame per method call that hasn't returned yet. A frame holds that call's local variables: primitive locals by value, and references (pointers) for objects. Objects themselves, including arrays and strings, live on the heap, which every thread in the JVM shares. Calling a method pushes a frame; returning pops it, so frames die in last-in, first-out order. When a frame pops, its references vanish, but the objects they pointed to stay on the heap until the garbage collector proves nothing can reach them. Run out of stack, usually through deep recursion, and you get StackOverflowError; run out of heap and you get OutOfMemoryError. -Xss sizes each thread's stack, -Xms and -Xmx size the heap.
What you’ll learn
- Draw a thread's JVM stack as a pile of frames and the heap as one shared area for every object
- Say exactly where a local
int, a reference, an object, a primitive field and a string literal live - Trace a
main()that calls another method, frame by frame, including the LIFO pop on return - Tell
StackOverflowErrorfromOutOfMemoryErrorand size them with-Xss,-Xmsand-Xmx - Explain what happens to heap objects when the last reference to them disappears
Interview radar
Asked very often: Where does a local variable live, and where does the object it points to live?
Core follow-up: Is the heap shared between threads? Is the stack?
Production angle: A service dies with StackOverflowError on one specific input. What do you look for first?
01Picture it first: notepads and a warehouse
Think of each thread as a worker with a personal notepad. Every time the worker starts a task (a method call), they tear off a fresh sheet and put it on top of the pad. They jot down short-lived notes on it: counters, flags, and the shelf numbers of things in the warehouse. When the task ends, they throw that sheet away. Nobody else ever reads their notepad.
The warehouse is the heap. It's one big shared building where all the real items (objects) are stored. Workers never carry objects around; they carry shelf numbers, which is what a reference is. Two workers can hold the same shelf number and look at the same item.
The figure below shows that split: three threads, each with its own stack of frames, all pointing into a single heap that also contains the string pool.
Three thread stacks, each holding its own frames, with arrows from those frames into one shared heap that contains a Customer object, a CheckoutDemo object, an Order object and a string pool shared by two threads
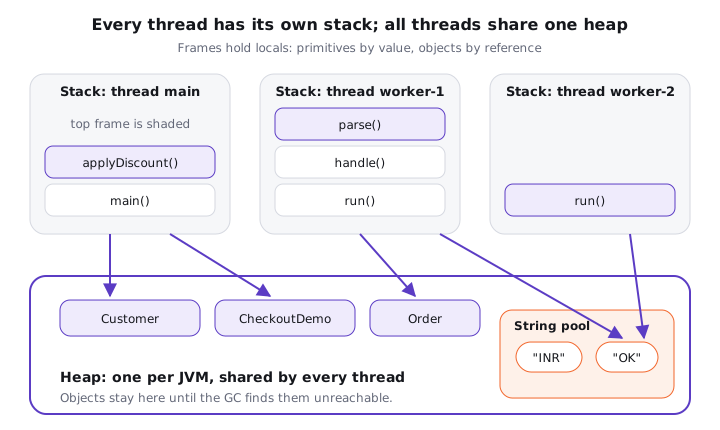
Notice three things in that picture:
- Stacks are per thread. The
mainthread can't see a local variable inworker-1's frame. - The heap is per JVM. Both worker threads point at the same pooled
"OK"string. - Arrows only go one way: frames point into the heap. That's what makes it safe to throw a frame away in one step.
02What lives where: the rules you need
The JVM specification describes a set of run-time data areas (JVMS §2.5). For this lesson, the two that matter are the per-thread JVM stack and the shared heap. Each stack holds frames (JVMS §2.6), and each frame has three parts: an array of local variables, an operand stack the bytecode uses as scratch space, and a link to the constant pool of the method's class.
Here's the rule set I'd say out loud:
| Thing in your code | Where it lives |
|---|---|
Local primitive, e.g. int qty = 3 |
In the frame's local variable array, by value |
Local reference, e.g. Customer c |
The reference is in the frame; the object is on the heap |
| Method parameters | Locals in the callee's frame (and this is local slot 0 for instance methods) |
Any object or array created with new |
Heap |
A primitive field, e.g. int age inside Customer |
Inside the object, so on the heap |
String literals like "INR" |
Interned String objects on the heap, in the string pool |
static fields |
On the heap, attached to the class's java.lang.Class object (covered in Metaspace: where classes live) |
The row people get wrong is the primitive field. "Primitives live on the stack" is only true for local primitives. An int field is part of its object, and the object is on the heap. A long[] of a million elements is one heap object holding eight million bytes of data, no matter how primitive its element type is.
The table describes the model the JVM spec gives you. The JIT compiler is free to keep locals in CPU registers, and with escape analysis HotSpot can remove an allocation entirely when an object never leaves a method, replacing it with its fields (scalar replacement). HotSpot does not move such objects onto the stack. You don't need more than one sentence on this in most interviews, but saying it shows you know the model is a model.
03Under the hood: tracing one call, frame by frame
Let's trace a small program. A checkout demo creates a customer, uses a currency code, and calls a helper method that takes the customer as an argument.
Try it yourself first
Before reading on, sketch the stack and the heap at the moment execution reaches the comment // snapshot here. How many frames are on the stack? How many String objects exist with the value "INR", and which variables point at the same object?
public class CheckoutDemo {

    public static void main(String[] args) {
        int quantity = 3;
        Customer buyer = new Customer("Asha");
        String currency = "INR";
        CheckoutDemo app = new CheckoutDemo();
        app.applyDiscount(buyer);
        System.out.println("done");
    }

    void applyDiscount(Customer customer) {
        Customer sameBuyer = customer;
        String code = "INR";
        String label = new String("INR");
        // snapshot here
    }
}

record Customer(String name) { }
Step 1: main() gets a frame
When the JVM starts the main thread and invokes main, it pushes a frame for it. That frame has slots for args, quantity, buyer, currency and app.
Step 2: main() fills its frame
quantity = 3stores the value3directly in its slot. No heap involved.new Customer("Asha")allocates aCustomerobject on the heap. The slotbuyerstores a reference to it."INR"is a string literal. The JLS says literals are interned (JLS §3.10.5), so the JVM looks up"INR"in the string pool, creates a pooledStringon the heap if it isn't there yet, and stores the reference incurrency.new CheckoutDemo()allocates another heap object, referenced fromapp.
Step 3: the call pushes a second frame
app.applyDiscount(buyer) pushes a new frame on top of main's. Because it's an instance method, local slot 0 holds this, which is the same object app refers to. The parameter customer gets a copy of the reference held in buyer. Java is pass-by-value; for objects, the value being copied is the reference, so both frames now point at the same Customer.
Inside the method:
sameBuyer = customercopies the reference again. Three slots across two frames, oneCustomerobject.code = "INR"hits the string pool, finds the existing entry, and reuses it.codeandcurrencypoint at the sameStringobject, socode == currencyistrue.new String("INR")always creates a freshStringobject on the heap, outside the pool.label == codeisfalse, whilelabel.equals(code)istrue.
The next figure is the snapshot you were asked to sketch: two frames on the stack, four objects on the heap, and the arrows that connect them.
The main thread's stack holds an applyDiscount frame on top of a main frame, with references pointing to one Customer object, one CheckoutDemo object, one non-pooled String and one pooled INR string on the heap
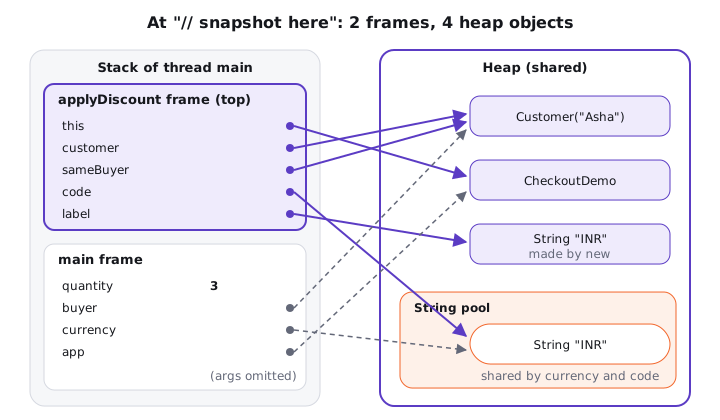
Notice three things:
quantityis the only slot that holds a value instead of an arrow.- Five slots point at only four heap objects. Sharing references is normal; copying a reference never copies the object.
- So two
Stringobjects hold"INR": the pooled one and the one made bynew.
Step 4: the return pops the top frame
When applyDiscount reaches its closing brace, its frame is popped. All five of its slots disappear at once, and control goes back to main right after the call. This is the LIFO rule: the frame pushed last is popped first. Nothing on the heap changes at this moment.
Step 5: main() returns
main prints done and returns, so its frame is popped too and the main thread's stack is empty. The sequence below shows the four stack states we walked through, from one frame to two and back to zero.
Four snapshots of the main thread's stack: main alone, applyDiscount pushed on top, applyDiscount popped, and an empty stack after main returns, while heap objects remain until the garbage collector runs
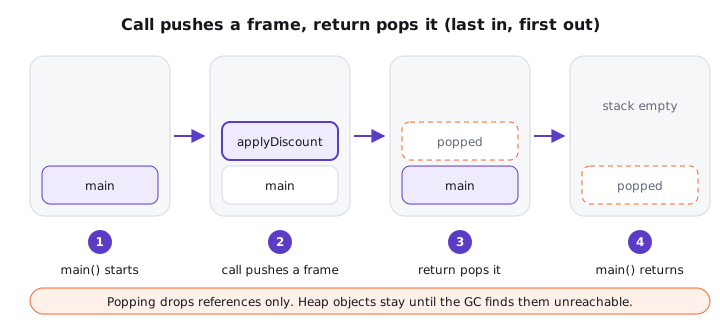
What about the objects on the heap?
Popping frames only removed references. The String created by new in applyDiscount lost its only reference when that frame popped, so from that instant it's unreachable and eligible for garbage collection. The Customer and CheckoutDemo objects stayed reachable until main returned, because main's frame still pointed at them.
Nobody frees these objects by hand. The garbage collector periodically traces everything reachable from GC roots (live stack frames, static fields, JNI handles and a few others), keeps what it can reach, and reclaims the rest. That's the whole subject of How garbage collection works. In this tiny program the JVM exits right after main, so the process memory goes back to the OS anyway; in a server that runs applyDiscount a million times an hour, the collector is what keeps the heap from filling up.
One more subtlety about the pooled "INR": the class's constant pool keeps it reachable for as long as CheckoutDemo stays loaded, so dropping currency and code doesn't make that literal collectable. Strings you intern yourself with intern() can be collected once nothing references them; since Java 7 the pool lives on the ordinary heap, so those entries are collected along with everything else.
04Per-thread stacks, one shared heap
Threads don't share stacks, and that has a practical payoff: local variables are thread-confined for free. If two threads run the same method at the same time, each gets its own frame with its own quantity. No locking needed.
The heap is the opposite. Any object reachable from two threads can be read and written by both. The danger is the object, not the variable. A local reference to a shared HashMap is thread-confined, but the map it points at is not.
class Counter {
    private int hits;              // field: lives inside the object, on the heap

    void handle() {
        int local = 0;             // each thread gets its own copy in its own frame
        local++;                   // always safe
        hits++;                    // races if two threads share this Counter
    }
}
This is why "stack versus heap" sits at the root of concurrency. When we talk about data races later in the course, we're really talking about heap objects reachable from more than one stack.
A team I worked with saw StackOverflowError only in production and only for a few tenants. The trigger was a recursive walk over an org chart: a handful of tenants had reporting chains thousands of levels deep, created by a bad import that made employees report to their own subordinates. The stack trace was the clue, the same few method names repeated until it was cut off. The fix was to detect the cycle and rewrite the walk as a loop over an explicit ArrayDeque, not to raise -Xss. A bigger stack would have bought one more week before the next bad import.
05When each one runs out
The two areas fail differently, and the error tells you which one ran out.
Stack. Each thread's stack has a fixed maximum size. If a thread needs more frames than fit, the JVM throws StackOverflowError (JVMS §2.5.2). The classic cause is recursion with no base case, or a base case that real data never reaches.
static int depth(int n) {
    return depth(n + 1);   // no base case: frames pile up until the stack is full
}
Heap. If the JVM can't find room for a new object even after collecting garbage and growing the heap to its limit, it throws OutOfMemoryError, usually with the message Java heap space. Leaks (objects kept reachable by mistake) and undersized heaps are the usual causes.
The flags that control the sizes, from the JDK 21 java command reference:
| Flag | Controls | Default |
|---|---|---|
-Xss1m |
Stack size per thread | Platform-dependent: 1024 KB on Linux/x64 and macOS/x64, 2048 KB on Linux/AArch64 and macOS/AArch64 |
-Xms2g |
Initial heap size | 1/64 of physical memory (HotSpot ergonomics) |
-Xmx2g |
Maximum heap size | 1/4 of physical memory (HotSpot ergonomics) |
For server deployments the JDK docs note that -Xms and -Xmx are often set to the same value, so the heap doesn't resize under load.
06Advanced: edge cases interviewers like
StackOverflowError is an Error, not an Exception. You can catch it, and frameworks sometimes do to fail one request instead of the whole thread. Do it only at a boundary where you can abandon the work; the stack has unwound by the time your handler runs, so there's room again, but whatever the recursion was building is half-done.
A bigger stack per thread isn't free. On 64-bit HotSpot, a platform thread's stack is reserved as virtual memory up front and committed as pages are touched. Reserving is cheap; committing is real memory. Raising -Xss affects every thread you create. If one code path needs a deep stack, give only that thread more room:
Runnable walk = () -> OrgChart.walk(root);
Thread deep = new Thread(null, walk, "org-walker", 16L * 1024 * 1024); // 16 MB hint
deep.start();
The stackSize argument is a hint; the Javadoc allows a platform to ignore it.
There are more OutOfMemoryErrors than heap. The message after the colon names the pool that ran out: Java heap space, Metaspace, Compressed class space, or unable to create native thread when the OS refuses to give the JVM memory or a thread for a new stack. Read the message before you raise -Xmx; for the last one, a bigger heap leaves less room for stacks and makes it worse.
Many candidates say "primitives go on the stack, objects go on the heap" and stop. That sentence is wrong for every primitive field and every primitive array. The precise version: locals live in frames, objects live on the heap, and fields live inside their object. Say "local" and "field" explicitly and the interviewer usually moves on satisfied.
- Stack allocation of a frame is a pointer bump: entering a method reserves its frame size and leaving gives it back. No GC work at all.
- Heap allocation on HotSpot is also fast in the common case: each thread allocates from its own TLAB (thread-local allocation buffer) inside the shared heap, which is a pointer bump too. The cost of the heap is paid later, by the collector.
- Thread count drives stack memory: 500 platform threads at the 1024 KB Linux/x64 default reserve about 500 MB of address space for stacks, outside
-Xmx. Container memory limits must leave room for this plus Metaspace and the code cache. - Recursion depth depends on frame size, JIT state and
-Xss, so measure instead of guessing: catchStackOverflowErrorin a test around a counter and print how deep you got.
Stack vs heap at a glance
| Stack | Heap | |
|---|---|---|
| Scope | One per thread | One per JVM, shared by all threads |
| Holds | Frames: local primitives, references, operand stack | Every object and array, string pool, Class objects with static fields |
| Lifetime | Frame lives exactly as long as its method call | Object lives until it's unreachable and the GC reclaims it |
| Freed by | Popping the frame on return or exception | The garbage collector |
| Order | Strict LIFO | No order; any object can die at any time |
| Thread safety | Locals are confined to their thread | Shared objects need synchronization |
| Size flag | -Xss (per thread) |
-Xms, -Xmx |
| Out of space | StackOverflowError |
OutOfMemoryError: Java heap space |
07How to say it in the interview
When I ask "what's the difference between stack and heap?", I'm listening for three things: that stacks are per thread and made of frames, that objects always live on the heap no matter who references them, and that you can tell the two errors apart. Bonus points if you correct the "primitives on the stack" shortcut yourself, or mention that popping a frame doesn't free objects, the GC does.
In the interview
"Every thread gets its own stack. Each method call pushes a frame holding that call's locals: primitive locals by value and references to objects. Returning pops the frame, so it's LIFO. All objects, including arrays and strings, live on the heap, which every thread shares; primitive fields live inside their object, so they're on the heap too. String literals are interned into the string pool, which is also on the heap. Popping a frame only drops references; the garbage collector later reclaims objects that are no longer reachable from GC roots like live frames and static fields. Too many frames gives StackOverflowError, usually from runaway recursion; a full heap gives OutOfMemoryError. I size them with -Xss per thread and -Xms and -Xmx for the heap. And because locals are per thread, they're thread-safe for free, while anything on the heap that two threads can reach needs synchronization."
On the whiteboard
thread -> own JVM stack -> frames (1 per active call)
frame = locals[] + operand stack + const pool link
local int -> value in frame | local ref -> arrow to heap
new X() / arrays / "literals" -> heap (shared, 1 per JVM)
int field -> inside object -> heap
call = push frame, return = pop (LIFO)
pop drops refs; GC frees unreachable objects later
too deep -> StackOverflowError   (-Xss, 1 MB Linux/x64)
heap full -> OOM: Java heap space (-Xms 1/64, -Xmx 1/4 RAM)
Interview questions for this topicComing soon
Further reading (8)
- JVM Specification §2.5 Run-Time Data Areas and §2.6 Frames (Java SE 21)
- JLS §3.10.5 String Literals (Java SE 21)
- The java command: -Xss, -Xms, -Xmx (JDK 21)
- HotSpot GC Tuning Guide, Ergonomics (JDK 21): Default initial heap 1/64 and maximum heap 1/4 of physical memory
- StackOverflowError (Java SE 21 API)
- String (Java SE 21 API), intern()
- HotSpot VM performance enhancements: escape analysis (JDK 21)
- Troubleshooting memory leaks and OutOfMemoryError (JDK 21)