

Processes vs threads
What the OS creates when you run java Main, what every thread in a JVM shares and keeps private, and how one core or many cores actually run your threads.
On this page
- Picture it first: two kitchens, many cooks
- What a process is, and who creates it
- What a thread is, and why main is never alone
- Under the hood: one process, three threads
- What threads share, and what each keeps private
- One run, end to end
- How the CPU actually runs threads
- Real world
- Benefits and challenges of multithreading
- Advanced: costs, misconceptions and comparisons
- How to say it in the interview
⚙️ What are processes and threads?
A process is a running program that the operating system has given its own private memory and resources. When you type java OrderService, the OS creates one process, and that process holds exactly one JVM. A thread is a single path of execution inside a process: the unit the OS scheduler actually puts on a CPU core. Every JVM process starts with a main thread, and threads in the same process share the heap while each keeps its own stack.
For this lesson, we'll build the model every later concurrency topic leans on: what the OS creates when you launch Java, what threads share and keep private, and how the CPU runs them. Interviewers love it because it looks like a warm-up and then turns into "where do static fields live?" and "what happens with 20 threads on 2 cores?". The follow-ups are where people run out of road.
Below the line (out of scope)
- Creating threads with
Thread,RunnableandCallable, and the thread lifecycle (later lessons in this module) - Locks,
volatileand the Java Memory Model in depth: start with wait(), notify() and notifyAll() and the synchronization interview questions - Stack frames and object allocation in detail: Stack vs heap
- Virtual threads (one note at the end; they get their own lesson)
The 30-second answer
Running java Main makes the OS create a process with its own address space, and one JVM runs inside it with its own heap (-Xms/-Xmx). Processes are isolated and share nothing by default. A thread is a unit of execution inside a process. All threads in a JVM share the heap (objects, arrays, static fields), Metaspace and the code cache; each keeps its own JVM stack, pc register and native stack. Platform threads map 1:1 to OS threads, so the OS time-slices them on a core, saving registers on each context switch. With N cores, up to N threads run truly in parallel.
What you’ll learn
- Explain that running
java Mainmakes the OS create one process holding one JVM, isolated from every other process - Size a process's heap with
-Xms/-Xmxand state the Java 21 defaults (1/64 and 1/4 of physical memory) - List what threads share (heap, static fields, Metaspace, code cache) and keep private (JVM stack, pc register, native stack)
- Map the classic OS code/data/heap/stack picture honestly onto JVM terms
- Describe time slicing and a context switch on one core versus true parallelism on N cores
- Separate concurrency from parallelism and multitasking from multithreading in one sentence each
- Print the PID and the JVM's own threads with
ProcessHandle,Thread.getAllStackTraces()andjcmd Thread.print
Interview radar
Asked very often: What is the difference between a process and a thread? Core follow-up: What do threads share, and what is private to each one? Where do static fields live? Production angle: Why does a service with 400 busy threads on a 2-CPU container get slower, not faster?
01Picture it first: two kitchens, many cooks
Picture two restaurant kitchens in separate buildings, each with its own fridge and recipe binder. A cook in kitchen A can't open kitchen B's fridge; to coordinate, somebody phones across. That's a process: a sealed space whose walls the OS enforces.
Inside one kitchen, several cooks work at once. They share the fridge and the binder, but each has a personal notepad and a finger on "the line I'm on right now". Those cooks are threads. When two of them reach for the last egg at the same moment, you get the classic multithreading bug.
Here's that picture with real Java names on it: two java commands, two processes, one JVM each, and the OS underneath both.
Two separate java commands create two isolated processes, each with its own JVM, heap, Metaspace, code cache and threads, running on the same operating system kernel
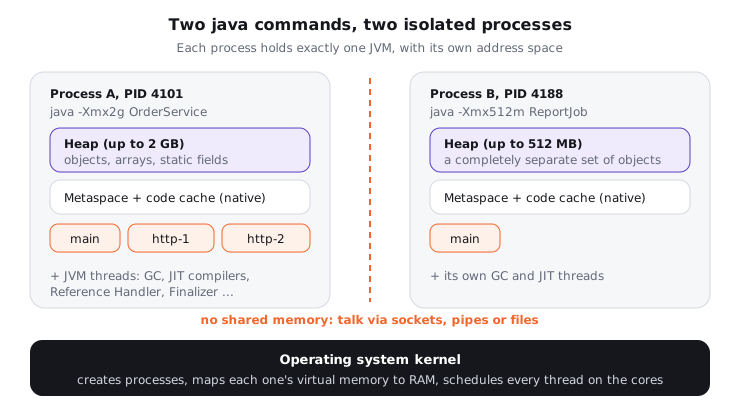
Notice the heap lives inside each process box. There's no machine-wide "JVM heap" that processes carve slices from, a wrong answer I hear often.
02What a process is, and who creates it
Let's walk through the moment you launch something:
javac OrderService.java        # produces OrderService.class (bytecode)
java -Xms256m -Xmx2g OrderService
The java launcher is a normal native program. Your shell asks the OS to start it (fork/exec on Linux and macOS, CreateProcess on Windows), so the OS creates the process, not the JVM. The process gets a PID, a private virtual address space and one initial thread, and the launcher loads the JVM into it. One process, one JVM. Run the command twice and you have two independent JVMs.
Isolation is the defining property. The OS maps each process's virtual addresses to different physical memory, so a bug in process A can't scribble over process B's objects. The price: processes can't talk through shared variables. They use sockets, pipes, files or OS shared-memory APIs, all slower and clumsier than reading a field.
What each JVM process gets: its own heap
Each JVM reserves its own heap when it starts. You size it per process:
-Xms256m: initial heap of 256 MB.-Xmx2g: maximum heap of 2 GB. If live objects need more, this process throwsOutOfMemoryError: Java heap space, even if the machine has 30 GB free.
Without flags, Java 21 picks an initial heap of 1/64 and a max of 1/4 of physical memory (in a container, of the container's limit, so a 2 GB pod gets about 512 MB). Each thread's stack is sized by -Xss: 1 MB on Linux/x64, 2 MB on Linux/AArch64 and macOS/AArch64.
There is no shared "JVM total heap" that processes draw from. Ten JVMs with -Xmx2g each can try to use 20 GB of heap between them, plus Metaspace, code cache and stacks. Physical RAM and container limits bound them, and if you over-commit, the OS or container runtime kills a process rather than sharing politely.
03What a thread is, and why main is never alone
A thread is an independent sequence of instructions with its own position in the code and its own call stack. The OS schedules threads, not processes: a process with zero runnable threads uses no CPU.
When the JVM starts, it runs your main method on a thread named main. Other threads appear only when code calls Thread.start() (directly or through a pool or server library). The JVM doesn't analyse your program upfront to decide how many threads it "needs"; they're created at runtime, one start() at a time.
And main is never alone. Before your first line runs, HotSpot has started its own helpers: GC threads, JIT compiler threads (C1 CompilerThread0, C2 CompilerThread0), Reference Handler, Finalizer, Signal Dispatcher and more. jcmd shows them:
jcmd                              # lists running JVMs and their PIDs
jcmd 4101 Thread.print            # full thread dump of PID 4101
A trimmed dump looks like this (exact names vary by JDK version and GC):
"main" #1 prio=5 ...
"Reference Handler" #9 daemon prio=10 ...
"Finalizer" #10 daemon prio=8 ...
"Signal Dispatcher" #11 daemon prio=9 ...
"C2 CompilerThread0" #14 daemon prio=9 ...
"C1 CompilerThread0" #17 daemon prio=9 ...
"VM Thread" ...
"GC Thread#0" ...
"G1 Main Marker" ...
04Under the hood: one process, three threads
Try it yourself first
Before reading on, predict the output. Will the two workers print the same PID as main? Will they always print in the order they were started? And which threads besides main will Thread.getAllStackTraces() report?
Here's the smallest program I use to make this concrete. It runs on Java 21:
import java.util.Comparator;

public class ProcessAndThreads {

    public static void main(String[] args) throws InterruptedException {
        long pid = ProcessHandle.current().pid();
        System.out.println("PID " + pid + ", running on: " + Thread.currentThread().getName());

        Runnable work = () -> {
            int local = 42; // lives in this thread's own stack frame
            System.out.println("  hello from " + Thread.currentThread().getName()
                    + " in PID " + ProcessHandle.current().pid() + ", local=" + local);
        };

        Thread a = new Thread(work, "worker-a");
        Thread b = new Thread(work, "worker-b");
        a.start();
        b.start();
        a.join();
        b.join();

        System.out.println("Java-visible threads in this JVM:");
        Thread.getAllStackTraces().keySet().stream()
                .sorted(Comparator.comparing(Thread::getName))
                .forEach(t -> System.out.println("  " + t.getName()
                        + (t.isDaemon() ? " (daemon)" : "")));
        System.out.println("Cores: " + Runtime.getRuntime().availableProcessors()
                + ", max heap: " + Runtime.getRuntime().maxMemory() / (1024 * 1024) + " MB");
    }
}
One run on my laptop printed:
PID 7347, running on: main
  hello from worker-b in PID 7347, local=42
  hello from worker-a in PID 7347, local=42
Java-visible threads in this JVM:
  Common-Cleaner (daemon)
  Finalizer (daemon)
  Notification Thread (daemon)
  Reference Handler (daemon)
  Signal Dispatcher (daemon)
  main
Cores: 14, max heap: 12288 MB
Notice four things:
- Same PID everywhere. All three threads live in one process. Rerun it and the PID changes: new process.
- Order isn't guaranteed.
worker-bprinted first althoughworker-astarted first. The OS scheduler decides. localis per thread. Each worker has its own copy in its own stack frame, so there's nothing to race on.getAllStackTraces()shows only Java threads. GC and JIT threads are internal VM threads; usejcmd Thread.printfor those. Rerun with-Xmx256mand the last line saysmax heap: 256 MB: heap size is per process.
05What threads share, and what each keeps private
Textbooks draw a process as four segments: code (read-only instructions), data (globals and statics), heap and one stack per thread. That's the C and OS view. A JVM process still has those segments for the JVM's own native code, but your Java program's state lives in the run-time areas the JVM spec defines, so let's map them honestly.
| Classic OS segment | Where that idea lives for your Java code | Shared or per thread? |
|---|---|---|
| Code segment | Bytecode and class metadata in the method area (HotSpot: Metaspace, native memory since Java 8); JIT-compiled machine code in the code cache | Shared |
| Data segment (globals, statics) | Java has no globals. Static fields live in the heap, alongside the class's java.lang.Class object (moved out of PermGen in JDK 7/8) |
Shared |
| Heap | The Java heap: every object and array, managed by the GC | Shared |
| Stack | One JVM stack per thread, holding frames with locals and operand stacks, plus a native stack for native code | Per thread |
| Program counter | One pc register per thread (JVMS §2.5.1) | Per thread |
| CPU registers | Saved by the OS into the thread's kernel structure while it isn't running | Per thread |
Here's the same split as a picture of one JVM process with three threads.
Inside one JVM process, the heap, Metaspace and code cache are shared by all threads, while each thread owns a pc register, a JVM stack and a native stack
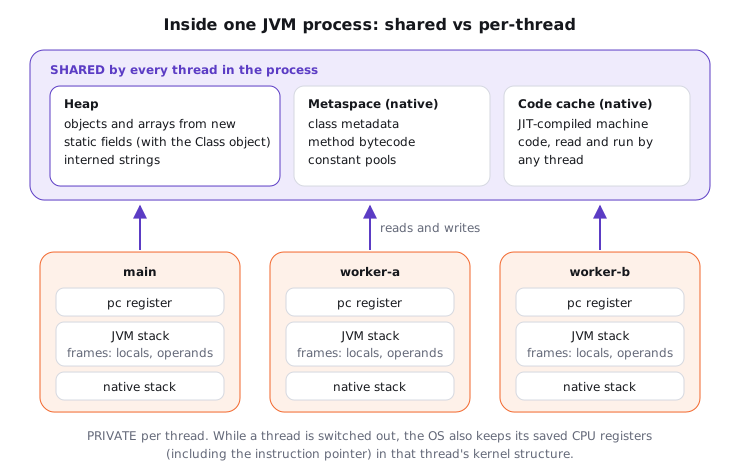
Interviewers probe three details here:
- Static fields are on the heap. The JLS says instance fields, static fields and array elements live in shared heap memory, while locals and parameters are never shared. Metaspace holds the class's description (methods, bytecode, constant pool), not static values. More in Metaspace: where classes live.
- The pc register holds the address of the bytecode instruction the thread is executing, and is undefined inside native methods. In JIT-compiled code the CPU's instruction pointer does that job, and the OS saves it on every switch.
- Primitive locals live in the frame; primitive fields live inside their object on the heap. An
int countlocal is private. Anint countfield on a shared object is not.
Because the heap is shared, two threads writing the same field need coordination. That's the whole reason locks, volatile and atomics exist.
06One run, end to end
Let's put the pieces in order for a Main that starts two worker threads:
- Compile.
javac Main.javawritesMain.class. Nothing is running yet. - Launch.
java -Xmx1g Main. The OS creates a process: new PID, new address space, one initial thread. - JVM boots. It reserves up to 1 GB of heap, sets up Metaspace and the code cache, and starts its GC, JIT and housekeeping threads.
- Classes load.
Main's metadata and bytecode go into Metaspace; its static fields go in the heap. mainruns. Themainthread gets a JVM stack and pc register and starts in the interpreter. Hot methods get JIT-compiled into the code cache.- Threads are born at runtime.
t1.start()asks the OS for a new native thread with its own stack, starting atrun(). Same fort2. - The OS schedules them all.
main,t1,t2and the JVM's helpers compete for cores, sharing code and heap, each from its own position. - Exit. When the last non-daemon thread ends (or
System.exitruns), the JVM shuts down and the OS reclaims the process's memory in one go.
07How the CPU actually runs threads
The CPU executes the code, and the OS scheduler decides which thread gets which core. Java platform threads are thin wrappers around OS threads, one to one, so to the scheduler a Java thread is an OS thread.
One core: time slicing and context switches
With one core and three runnable threads, only one instruction stream runs at any instant. The scheduler gives each thread a time slice (typically milliseconds, depending on the OS and load) and then switches. A thread can also give up the core early by blocking on I/O, a lock or sleep.
A context switch looks like this:
- An interrupt or a blocking call enters the kernel.
- The kernel saves the outgoing thread's CPU registers, including the instruction pointer and stack pointer, into that thread's kernel structure (often called the thread control block).
- The scheduler picks the next runnable thread.
- The kernel restores that thread's saved registers and returns to user mode, so it resumes exactly where it stopped.
The saved registers plus the thread's own stack are what let it resume mid-method as if nothing happened.
N cores: real parallelism, plus time slicing for the rest
With N cores, up to N threads execute at the same physical instant. The figure below compares three threads on one core with the same three threads on two cores.
On one core three threads take turns with a context switch between each slice, while on two cores two threads run at the same instant and the third is time-sliced in
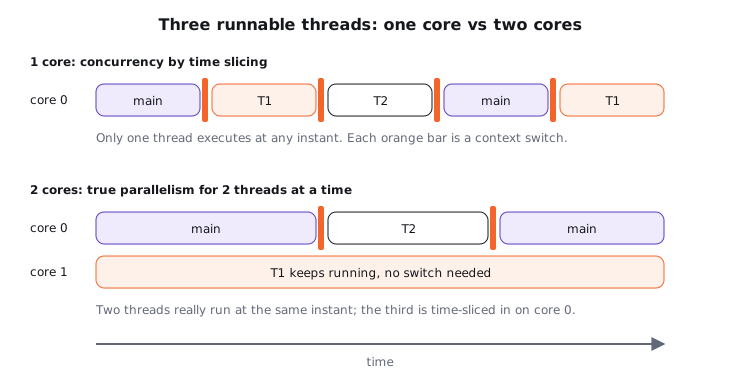
So with 2 cores and 20 runnable threads, 2 run truly in parallel at every instant and 18 wait: parallelism and time slicing together. With 4 cores and 3 runnable threads, each can keep its own core (other processes and JVM helper threads may still cut in).
Concurrency vs parallelism
- Concurrency is about structure: several tasks are in progress during the same period, and their steps may interleave. One core is enough.
- Parallelism is about execution: several tasks run at the same instant on different cores. It needs more than one core.
A concurrent program on one core is still concurrent. It is never parallel.
08Real world
A common incident pattern: a CPU-heavy service runs in a container limited to 2 CPUs, and someone raises a pool from 16 to 400 threads "to go faster". Throughput drops. At most 2 threads compute at any instant, so the other 398 add context switches, cache misses and up to 400 MB of reserved stack (at 1 MB each) without adding work done. The fix is sizing CPU-bound pools near availableProcessors() and keeping large pools for threads that mostly wait on I/O. My first two tools here are jcmd <pid> Thread.print and, on Linux, top -H -p <pid> to see which threads burn CPU.
09Benefits and challenges of multithreading
Multithreading means one program running several threads that share its resources. The benefits:
- Parallel speed-up. Split CPU-bound work across threads and N cores can work on it at once. One thread on an 8-core box leaves 7 cores idle.
- Responsiveness. A slow database call on one thread doesn't freeze the others.
- Cheap sharing. Threads read the same objects directly, with no serialising across a pipe.
The challenges come from that same sharing:
- Data races and lost updates. Two threads doing
count++on a shared field can both read 5 and both write 6. - Coordination costs. Locks and
synchronizedblocks fix races but add waiting, and lock ordering mistakes cause deadlocks. See wait(), notify() and notifyAll() and the synchronization interview questions. - Visibility. Without a happens-before edge, one thread may not see another's write at all.
- Hard to test. Timing-dependent bugs hide on your laptop and surface under load. The concurrency reference article covers the toolbox.
My default: start with no shared mutable state (a thread pool passing immutable data), and add shared state and locks only where you've measured a need.
10Advanced: costs, misconceptions and comparisons
Many candidates say "if you have more threads than cores, there's no real parallelism, it's all an illusion". That's wrong. With 2 cores and 20 threads, 2 threads truly run in parallel at every instant; the remaining 18 are time-sliced. The other classic slip is "each thread has its own heap". Threads share one heap per process; it's processes that each get their own.
A context switch is not free. In Benoit Sigoure's published Linux measurements on Intel Xeons (2010 to 2013 hardware), a forced switch between two tasks cost about 3 to 4.5 µs when they could migrate between cores, and about 1.1 to 1.7 µs for a thread switch with both pinned to one core. That's a floor: the benchmark did no real work, so caches stayed warm. In real code the bigger cost is indirect, because the incoming thread finds the caches and TLB full of someone else's data. Measure on your own hardware before quoting a number.
Some depth that separates strong answers:
- Thread switch vs process switch. Threads of one process share an address space, so switching between them keeps page tables; a process switch swaps them. That's largely why threads are "lightweight".
- Stack memory is reserved, not always committed.
-Xss1mreserves 1 MB of address space per thread and the OS commits pages as the stack grows. Thousands of platform threads still add up, and the OS caps threads per process. - Container awareness. Since JDK 10 (backported to 8u191), HotSpot reads cgroup limits, so
availableProcessors()and the default heap reflect the container, not the host. - Virtual threads (Java 21). JEP 444 changes the 1:1 mapping: many virtual threads run on a small pool of carrier OS threads. They get their own lesson.
Multitasking vs multithreading
| Multitasking (many processes) | Multithreading (many threads, one process) | |
|---|---|---|
| Unit | Separate processes, e.g. two java commands |
Threads inside one process |
| Memory | Each has its own address space and heap | One shared heap, Metaspace and code cache |
| Private per unit | Everything | JVM stack, pc register, native stack, saved CPU registers |
| Communication | Sockets, pipes, files, OS shared memory | Read and write shared objects directly |
| Failure blast radius | A crash stays inside one process | An OutOfMemoryError or a JVM crash takes every thread down |
| Switch cost | Higher (address space changes) | Lower (same address space) |
| Main risk | Heavier startup and memory per unit | Races, deadlocks, visibility bugs |
11How to say it in the interview
When I ask this question, I'm listening for three things. Do you know the OS creates the process and that each JVM process owns its own heap? Can you list shared versus private correctly, including where static fields live? And can you explain context switching and the cores-versus-threads question without saying "it's all an illusion"?
In the interview
"Running java Main makes the OS create a process with its own address space, and one JVM runs inside it with its own heap, sized by -Xms and -Xmx. Processes are isolated and talk through sockets, pipes or files. Inside, the JVM runs main plus its own GC and JIT threads, and my code adds threads with Thread.start(). Threads share the heap, including static fields, plus Metaspace and the code cache. Each keeps its own JVM stack, pc register and native stack, which is why locals are thread-safe and shared fields aren't. Platform threads map 1:1 to OS threads, so on one core the OS time-slices them, saving registers on each context switch. With N cores, N run truly in parallel and the rest are time-sliced: that's parallelism versus concurrency."
Here's how this might look if you sketch it on the whiteboard:
On the whiteboard
Process vs thread
java Main→ OS creates process (PID, own address space) → 1 JVM- per process: own heap (-Xms/-Xmx; default 1/64, 1/4 of RAM)
- shared by threads: heap (objects + statics), Metaspace, code cache
- private per thread: JVM stack, pc register, native stack (-Xss, 1 MB Linux/x64)
- JVM threads too: GC, C1/C2, Reference Handler, Finalizer
- 1 core: time slice + context switch (save/restore registers, PC)
- N cores: N in parallel, rest time-sliced
- concurrency = interleaved; parallelism = same instant
- Java 21 virtual threads: M:N, separate lesson
Interview questions for this topicComing soon
Further reading (10)
- JVM Specification (Java SE 21) §2.5: Run-Time Data Areas: pc register, JVM stacks, heap, method area, native method stacks
- Java Language Specification (Java SE 21) §17.4.1: Shared Variables: instance fields, static fields and array elements live in shared heap memory; locals are never shared
- HotSpot GC Tuning Guide (Java 21): Ergonomics: default initial heap 1/64, max heap 1/4 of physical memory; server-class rule
- The java command (Java SE 21): -Xms, -Xmx, -Xss defaults, -XX:ReservedCodeCacheSize, -XX:MaxMetaspaceSize
- The jcmd command (Java SE 21)
- ProcessHandle (Java SE 21 API)
- Thread (Java SE 21 API)
- JEP 122: Remove the Permanent Generation: class metadata to native Metaspace; statics and interned strings out of PermGen
- JEP 444: Virtual Threads: platform threads are thin wrappers around OS threads
- Benoit Sigoure: How long does it take to make a context switch?: measured Linux context-switch costs on Intel Xeons, 2010 to 2013