

JVM, memory and garbage collection: the must-knows
A dense revision sheet on JVM internals for interviews: class loading and parent delegation, runtime data areas, object headers, JIT tiers, GC roots and generations, choosing between Serial, Parallel, G1, ZGC and Shenandoah, reference types, leaks, every OutOfMemoryError message and the tools to diagnose them.
On this page
- Picture it first: the JVM in one diagram
- Class loading: load, link, initialize
- Runtime data areas: what lives where
- Object layout: what an object costs
- Interpreter and JIT: how bytecode becomes fast
- GC basics: reachability, generations, pauses
- The collectors and how to choose
- Reference types: strong, soft, weak, phantom
- Memory leaks in Java: the five you must name
- Every OutOfMemoryError message, decoded
- Flags and tools you should name without thinking
- Senior probes: where candidates lose points
- How to say it in the interview
🧠 What is this sheet?
It's the JVM and garbage collection round compressed into one sitting: how a class gets into the JVM, where every byte of your program lives, how the JIT turns hot bytecode into machine code, and how the collector decides what to free. These are the items I've seen decide JVM rounds, from "what's the difference between stack and heap" for a two-year engineer to "your pod restarts with exit code 137 and no OutOfMemoryError, what now?" for a senior one. Every item carries the exact fact or number you should say, and a link to the full lesson.
For this sheet, we'll walk the JVM from the outside in: architecture, class loading, runtime data areas, object layout, the JIT, then GC basics and the collectors. The second half goes where senior rounds go: reference types, leaks, every OutOfMemoryError message, the flags and tools, a GC log line read out loud, and the talk track. Everything is correct for Java 21 on HotSpot (the JVM inside OpenJDK, Oracle JDK, Temurin and Corretto), and I flag where older or newer versions differ.
Below the line (out of scope)
- Heap sizing, G1 internals and production signals in full: Java memory management: heap, G1 and the signals that matter
- CPU profiling and reading flame graphs: How to read a flame graph
- The Java Memory Model,
volatileand happens-before: Multithreading and the JMM: the must-knows - Deep dives on bytecode, class loaders and the JIT: Module: JVM Internals
The 30-second answer
The JVM has three parts: the class loader subsystem loads, links and initializes classes using parent delegation (bootstrap, platform, application); the runtime data areas hold them, with the heap and metaspace shared by all threads and a stack, PC register and native stack per thread; and the execution engine interprets bytecode, JIT-compiles hot methods through C1 and C2, and runs the garbage collector. Objects live on the heap, locals and references live in stack frames, and class metadata lives in metaspace, which replaced PermGen in Java 8. GC starts from roots (stack locals, static fields, active threads, JNI handles) and frees whatever it can't reach. Because most objects die young, the heap is generational: cheap, frequent young collections, and rarer old ones. Java 21 defaults to G1 with a 200 ms pause goal; I'd pick ZGC for sub-millisecond pauses on large heaps and Parallel for pure batch throughput.
What you’ll learn
- Draw the JVM architecture (class loaders, runtime data areas, execution engine) and say what lives on the heap, the stack and in metaspace
- Explain loading, linking and initialization, parent delegation, and exactly when a static initializer runs
- Describe GC roots, the generational hypothesis and the minor, mixed and full GC lifecycle, with object sizes and header layout
- Choose between Serial, Parallel, G1, ZGC and Shenandoah with defaults, flags and real pause numbers
- Recognise the five classic memory leaks and map each OutOfMemoryError message to its cause and fix
- Diagnose with jcmd, jstat, jmap, jstack and JFR, and read a unified GC log line out loud
Interview radar
Asked very often: Stack vs heap. What is metaspace and why did PermGen go? How does GC decide what's garbage? Minor vs full GC. Which collector is the default?
Senior rounds probe: Parent delegation and why two classes named com.acme.User can fail a cast; when exactly static init runs; escape analysis; G1 vs ZGC trade-offs; the OOM message for each failure; reading a GC log.
Production angle: Heap after GC climbing for days, a ThreadLocal leak in a pooled server, "unable to create native thread", and the container OOM-kill that never shows up as a Java error.
01Picture it first: the JVM in one diagram
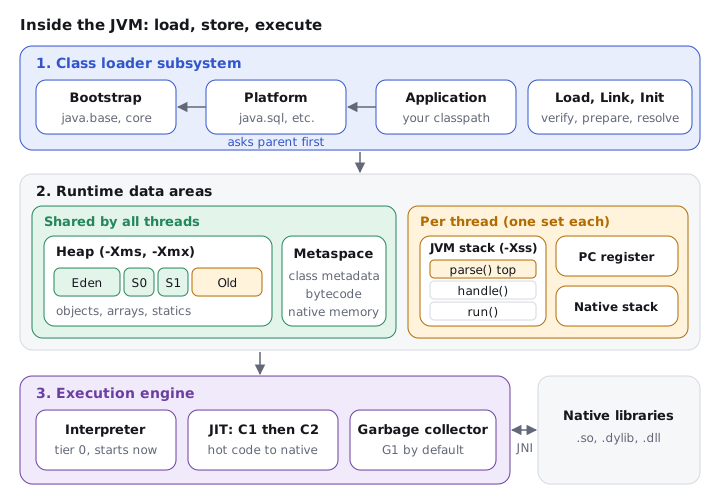
Think of the JVM as a small factory. The class loaders are receiving: they accept .class files, inspect them and file them. The runtime data areas are the floor space: one big shared warehouse (the heap), a records office for blueprints (metaspace), and a private workbench for each worker (thread stacks). The execution engine is the workforce: an interpreter that reads instructions one by one, a JIT that rewires the busiest stations into machines, and a cleaning crew (the GC) that clears the warehouse.
The diagram below is the one I'd expect you to draw in the first two minutes of a JVM round. Notice the split between what's shared and what belongs to a single thread.
JVM architecture: the class loader subsystem with bootstrap, platform and application loaders feeds the runtime data areas, where heap and metaspace are shared and each thread has its own stack, PC register and native stack, and the execution engine with interpreter, JIT and garbage collector runs the code and calls native libraries through JNI
- JVM vs JRE vs JDK: the JVM runs bytecode; the JDK is the JVM plus the class library plus tools (
javac,jcmd,jlink). Since Java 11, Oracle no longer ships a separate JRE (a few vendors still package one); you build a trimmed runtime withjlink. JDK, JRE and JVM explained - Write once, run anywhere:
javacproduces platform-neutral bytecode; each OS has its own JVM that interprets and compiles it. From source to bytecode
02Class loading: load, link, initialize
A class enters the JVM in three phases, defined in chapter 5 of the JVM spec. Interviewers ask this to see whether you know that "loading a class" and "running its static block" are different moments.
| Phase | What happens | What can go wrong |
|---|---|---|
| Loading | A class loader finds the bytes (jar, module image, network) and creates the Class object |
ClassNotFoundException (explicit load by name), NoClassDefFoundError (implicit load, class missing at runtime) |
| Linking: verify | Bytecode verifier checks types, stack depth, no jumps outside the method | VerifyError |
| Linking: prepare | Static fields are allocated and set to default values (0, null, false) |
|
| Linking: resolve | Symbolic references (com/acme/User.name) become direct references; HotSpot does this lazily, on first use |
NoSuchMethodError, NoSuchFieldError (version mismatch between jars) |
| Initialization | The JVM runs <clinit>: static field initializers and static {} blocks, in source order, once, under a lock |
ExceptionInInitializerError, then NoClassDefFoundError: Could not initialize class X on every later use |
Parent delegation is the rule every built-in loader follows: before loading a class itself, a loader asks its parent. The chain is bootstrap (native code, loads java.base and other core modules), platform (Java 9+, replaced the extension loader; loads modules like java.sql), and application (also called system, loads your classpath and module path). The reasons are safety and uniqueness: nobody can slip in their own java.lang.String, and a class is loaded once per hierarchy.
- Class identity is name plus defining loader: the same
com.acme.Userloaded by two loaders is two different classes, which is how you getClassCastException: com.acme.User cannot be cast to com.acme.Userin app servers and plugin systems. - Who breaks delegation on purpose: Tomcat's webapp loader looks in the WAR first (child-first) so each app can ship its own library versions;
ServiceLoaderand JDBC use the thread context class loader so core code can find classes on your classpath. Class.forName("X")initializes,loader.loadClass("X")doesn't: that's why old JDBC code calledClass.forNameon the driver, to run its static block that registered it.
Static init runs on the first active use of the class: new, a static method call, reading or writing a static field that isn't a compile-time constant, reflection like Class.forName, initializing a subclass (the parent goes first), or being the main class. It does not run for a static final primitive or String with a constant initializer (the compiler inlines the value), for Foo.class, or for new Foo[10].
Try it yourself first
Before running it, predict every line this prints, in order.
class Config {
    static final int MAX = 10;            // compile-time constant, inlined by javac
    static final Integer BOXED = 20;      // not a constant: needs initialization
    static { System.out.println("Config init"); }
}

public class Main {
    public static void main(String[] args) {
        Config[] slots = new Config[3];   // no init: an array of Config is its own class
        System.out.println(Config.MAX);   // no init: 10 was copied into Main's bytecode
        System.out.println(Config.BOXED); // first active use
    }
}
The output is 10, then Config init, then 20. Notice two things. The array creation and the constant read never touch Config, and the static block runs exactly once, right before the first real use. This is also why lazy holder singletons work: the nested Holder class isn't initialized until getInstance() reads its field, and the JVM's class-init lock makes it thread-safe for free. More in The static keyword in Java.
03Runtime data areas: what lives where
The JVM spec defines six runtime data areas. Two are shared, three are per thread, and one (the runtime constant pool) lives inside the method area.
| Area | Shared? | Holds | Sized by | Error when full |
|---|---|---|---|---|
| Heap | All threads | Every object and array, the string pool, static field values (HotSpot keeps them with the Class mirror) |
-Xms, -Xmx |
OutOfMemoryError: Java heap space |
| Method area (Metaspace) | All threads | Class metadata, method bytecode, runtime constant pool | -XX:MaxMetaspaceSize (unbounded by default) |
OutOfMemoryError: Metaspace |
| JVM stack | Per thread | One frame per call: local variables, operand stack, return info | -Xss (1 MB default on 64-bit Linux) |
StackOverflowError |
| PC register | Per thread | Address of the bytecode instruction being executed (undefined in native code) | fixed, tiny | never |
| Native method stack | Per thread | Frames of C/C++ code called through JNI | OS thread stack | StackOverflowError or a crash |
- Metaspace replaced PermGen in Java 8 (JEP 122). PermGen was a fixed-size part of the heap that ran out with
OutOfMemoryError: PermGen spacewhen apps loaded many classes or redeployed. Metaspace lives in native memory and grows on demand, so the classic failure became a slow native-memory leak instead. Interned strings and static values had already moved to the heap. - Stack vs heap in one sentence: the stack holds primitives and references local to a method call and disappears when the call returns; the heap holds the objects those references point to and is cleaned by the GC.
User u = new User()puts the referenceu(4 bytes with compressed oops) in the frame and theUserobject on the heap. - Fields live with their object: an
intfield of a heap object is on the heap, not the stack. "Primitives go on the stack" is only true for local variables. - Stacks are thread-safe by construction: nothing else can see your frame, which is why local variables never need synchronization but shared heap objects do.
Escape analysis is the JIT's answer to "can objects ever avoid the heap?". C2 checks whether an object escapes the method (stored in a field, returned, passed to code it can't inline). If it doesn't, C2 can apply scalar replacement: it never allocates the object and keeps its fields in registers or stack slots. HotSpot doesn't allocate whole objects on the stack; it removes them. It also enables lock elision on objects no other thread can see.
// After C2 compiles this method, Point is usually never allocated:
// p doesn't escape, so x and y live in registers.
record Point(int x, int y) {}

static long distanceSquared(int x, int y) {
    Point p = new Point(x, y);
    return (long) p.x() * p.x() + (long) p.y() * p.y();
}
04Object layout: what an object costs
Premium lesson
Keep reading with the Java Pass
The rest of this lesson is part of Java One-Stop Interview Prep: in-depth explanations, diagrams, model answers and how to say them in the interview.
- Interpreter and JIT: how bytecode becomes fast
- GC basics: reachability, generations, pauses
- The collectors and how to choose
- Reference types: strong, soft, weak, phantom
- Memory leaks in Java: the five you must name
- Every OutOfMemoryError message, decoded
- Flags and tools you should name without thinking
- Senior probes: where candidates lose points
- How to say it in the interview
From ₹199 · one-time payment · No auto-renewal
Interview questions for this topicComing soon
Further reading (8)
- The Java Virtual Machine Specification, Java SE 21: Chapter 2 (runtime data areas) and Chapter 5 (loading, linking, initializing)
- HotSpot Virtual Machine Garbage Collection Tuning Guide (Java SE 21)
- Troubleshooting Guide: Troubleshoot Memory Leaks, including the OutOfMemoryError messages (Java SE 21)
- JEP 439: Generational ZGC
- JEP 248: Make G1 the Default Garbage Collector
- JEP 122: Remove the Permanent Generation
- java.lang.ref package (Java SE 21 API)
- JOL: Java Object Layout (OpenJDK code tools): Use it to verify object sizes and header layout on your own JVM.