

Java memory management: heap, G1 and the signals that matter
How the JVM lays out memory, how G1 collects it, and the handful of signals that tell you whether you have a leak, an allocation problem or a healthy service.
On this page
- Picture the JVM's memory first
- How G1 organises the heap
- The G1 cycle: young-only, space reclamation, and the emergency exit
- The signals that matter
- Reading a GC log
- When it crashes: the OutOfMemoryError workflow
- Code that causes it, and the fix
- Alerting without the noise
- Advanced: pitfalls, numbers and a production flag set
- How to say it in the interview
🧠 What is Java memory management?
It's the deal the JVM makes with you: you call new, and the garbage collector finds and frees the objects you no longer reach. The deal has a price. Every collection costs CPU and, for part of the time, pauses your threads, so a service with a 4 GB heap might stop for 15 ms twenty times a minute without anyone noticing, or for 3 seconds once an hour and page someone at night.
For this lesson, we'll focus on Java 21 with G1, the default collector since Java 9. We'll build the mental model (what lives where, how G1 cleans it), then spend most of our time on what interviewers and on-call engineers care about: which signals tell you something is wrong and what to do when the process dies. Memory problems reach users in two shapes: latency (GC pauses stretch your p99, or GC eats CPU your requests needed) or crashes (an OutOfMemoryError, or the container killed from outside).
Below the line (out of scope)
- Detailed heap sizing for a given workload (see Heap sizing (later in this module))
- Measuring and cutting allocation in hot code (see Allocation rate and GC pressure (later in this module))
- ZGC and Shenandoah internals (we only place them on the map)
- Off-heap data structures and memory-mapped files
The 30-second answer
The heap holds your objects and is capped by -Xmx; metaspace, code cache, thread stacks and direct buffers live outside it, which is why RSS is always bigger than -Xmx. G1 splits the heap into equal regions, collects the young regions often with short stop-the-world pauses, marks the old regions concurrently once occupancy passes about 45%, and then cleans the emptiest old regions in mixed GCs, aiming for 200 ms pauses. The signal I trust most is heap occupancy after GC: flat means healthy, climbing means a leak or a growing working set. I pair it with GC time %, allocation rate, pause p99 and any full GC, and when it crashes I go straight to the heap dump in Eclipse MAT.
What you’ll learn
- Why **RSS is bigger than
-Xmx** and how heap defaults work in containers - How G1 uses regions, young GCs, concurrent marking and mixed GCs, and when it falls back to a full GC
- Which signals matter: heap after GC, GC time %, allocation rate and pause p99, and how to read them from
jstat, JFR, MXBeans and GC logs - How to read a unified GC log line and spot evacuation failures, humongous allocations and full GCs
- A repeatable OutOfMemoryError workflow with heap dumps and Eclipse MAT, plus alerts that are not noisy
01Picture the JVM's memory first
Think of the JVM process as a rented flat. The heap is the living room, and -Xmx is its size on the lease. But the flat also has a kitchen and a hallway, and the landlord (your container limit) measures the whole flat.
A JVM process holds the Java heap plus several native areas, so resident memory is always larger than -Xmx
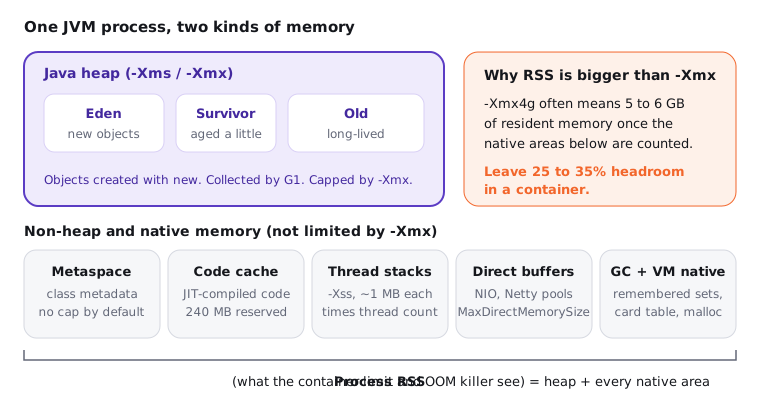
The heap is where every object you create with new lives. -Xms sets its starting size and -Xmx its ceiling. If you set neither, the JVM's ergonomics pick them for you: the initial heap is 1/64 of available memory and the maximum is 1/4. Since Java 10 (and 8u191), the JVM is container aware, so "available memory" means the cgroup limit, not the host's RAM. In a container you usually steer this with percentages instead of fixed sizes: -XX:MaxRAMPercentage (default 25) and -XX:InitialRAMPercentage (default 1.5625).
Everything else in the figure is non-heap memory, and -Xmx limits none of it. Metaspace is unbounded unless you set -XX:MaxMetaspaceSize, 400 threads at the default 1 MB -Xss can reserve 400 MB of stack, and direct buffers default to a cap roughly equal to the max heap. That's why -Xmx4g often settles at 5 to 6 GB of RSS. Many candidates are quick to set -Xmx equal to the container limit, and this is frequently a mistake because the kernel OOM killer counts the native areas too. A good default is -XX:MaxRAMPercentage somewhere between 65 and 75, then check actual RSS under load with Native Memory Tracking.
02How G1 organises the heap
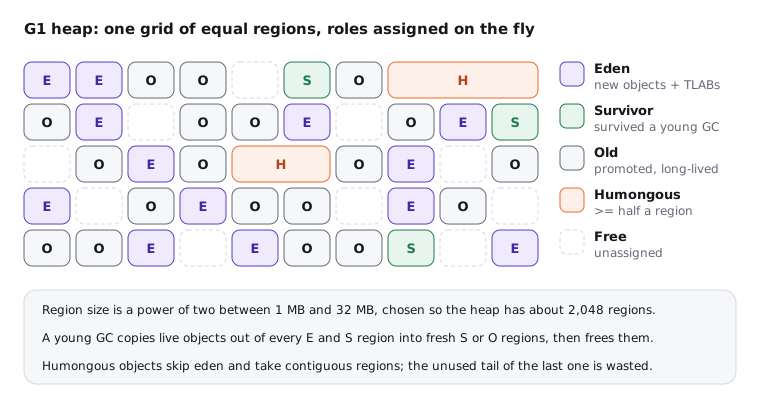
Older collectors split the heap into two fixed, contiguous halves: young and old. G1 (Garbage-First) throws that layout away. It cuts the heap into about 2,048 equal-sized regions of 1 to 32 MB (a power of two, chosen from the heap size or set with -XX:G1HeapRegionSize), and each region gets a role only while it's in use.
G1 divides the heap into equal regions whose role (eden, survivor, old, humongous or free) changes over time
Here's the life of an object, region by region:
- Allocation in eden. Each thread grabs a private chunk of an eden region called a TLAB (thread-local allocation buffer) and allocates by bumping a pointer. No locks, a handful of instructions. That's why
newis cheap. - Young GC. When eden fills up, G1 stops the application, copies the live objects out of eden and survivor regions into fresh survivor regions, and frees the rest wholesale. Most objects die young, and dead objects cost nothing: only survivors are copied.
- Aging and promotion. Every young GC an object survives increments its age. Once it reaches the tenuring threshold (at most 15, set by
-XX:MaxTenuringThreshold, and lowered dynamically when survivor space is tight), it's copied into an old region instead. - Humongous objects. An object of at least half a region (a 3 MB
byte[]with 4 MB regions) skips eden entirely and takes one or more contiguous humongous regions. The unused tail of the last region is wasted, and too many of these fragment the heap.
03The G1 cycle: young-only, space reclamation, and the emergency exit
G1 alternates between two phases. This diagram is worth drawing from memory: it explains most lines in a GC log.
G1 alternates between a young-only phase and a space-reclamation phase, with a full GC as the last-resort fallback
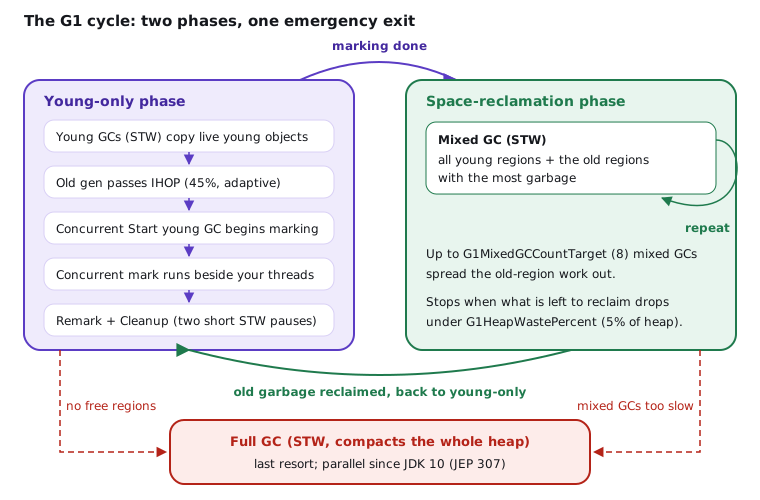
In the young-only phase, G1 runs young GCs and watches old-generation occupancy. When it crosses the Initiating Heap Occupancy Percent (IHOP, -XX:InitiatingHeapOccupancyPercent, 45% of the heap by default), the next young GC becomes a Concurrent Start pause and kicks off concurrent marking. Since Java 9, adaptive IHOP treats 45% as a starting point and learns when to start marking so it finishes before the heap fills. Marking runs alongside your threads, then two short pauses (Remark and Cleanup) finish the job.
Now G1 knows how much garbage each old region holds. In the space-reclamation phase, it runs mixed GCs: each one collects all young regions plus a batch of the old regions with the most garbage (hence "garbage first"). By default it spreads this over up to 8 mixed GCs (G1MixedGCCountTarget) and stops once the remaining reclaimable space drops under 5% of the heap (G1HeapWastePercent). Then it's back to young-only.
One goal steers all of this: -XX:MaxGCPauseMillis=200. G1 sizes eden and picks old regions so each pause fits. It's a goal, not a promise.
When the plan fails (no free regions to copy into, or the old generation fills faster than mixed GCs can clean it), G1 falls back to a full GC: a stop-the-world compaction of the entire heap. Until Java 10 that was single-threaded; JEP 307 made it parallel. It's still the event you never want to see, because on a multi-GB heap it takes seconds.
If 200 ms pauses are too long, ZGC does nearly all its work concurrently and keeps pauses under a millisecond. In Java 21, enable Generational ZGC (JEP 439) with -XX:+UseZGC -XX:+ZGenerational. You pay in CPU and memory headroom, so start with G1 until its pauses no longer serve you.
04The signals that matter
A JVM exposes hundreds of numbers. Five of them tell you nearly everything:
- Heap after GC (old-generation occupancy right after a collection). This is your live data set. If it's flat, you're fine. If it trends up over hours, you either have a leak or a working set that's legitimately growing (a cache warming up, more tenants), and you need to know which.
- Old-generation occupancy rising between marking cycles: objects are promoted faster than mixed GCs reclaim them.
- % of time in GC. G1's default
-XX:GCTimeRatio=12means it aims to spend at most 1/(1+12), about 8%, of time in GC, and grows the heap if it overshoots. Below 2 to 3% is healthy for most services. - Allocation rate in MB/s. It drives how often young GCs happen. A sudden jump after a deploy usually means a new hot allocation path.
- Pause p99 and max, plus a count of full GCs (which should be zero).
The single most useful picture is the sawtooth. Heap usage climbs as you allocate and drops at each GC. The tops of the teeth tell you little; the floor after each GC tells you the truth.
Heap usage forms a sawtooth: in a healthy service the floor after GC stays flat, in a leak it climbs until full GCs and an OutOfMemoryError
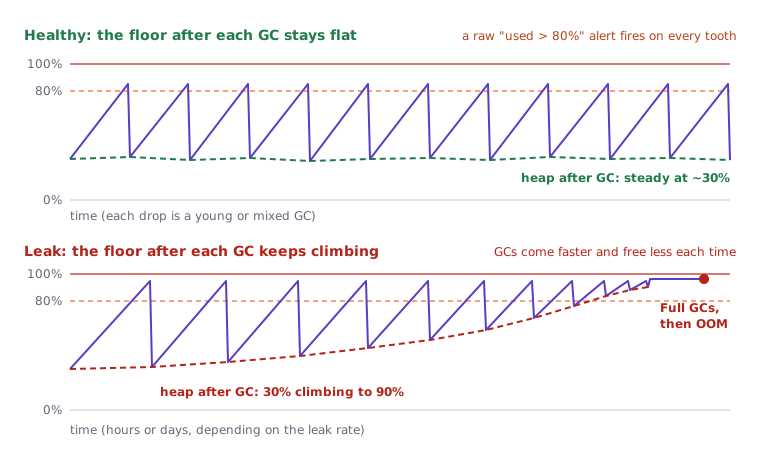
Notice what happens to a naive "heap used above 80%" alert on the healthy chart: it fires on every tooth, even though nothing is wrong. We'll come back to that when we set up alerts.
Where to read them
Try it yourself first
Before reading on: which JMX attribute would give you "heap after GC" without parsing any logs? Hint: it isn't HeapMemoryUsage.
You have four vendor-neutral places to look, from quickest to richest.
jstat for a live glance at a running JVM:
jstat -gcutil <pid> 1000      # one line per second
  S0     S1     E      O      M     CCS    YGC     YGCT    FGC    FGCT    CGC    CGCT     GCT
  0.00 100.00  63.41  41.27  97.80  94.10    812   9.412     0   0.000     24   0.311   9.723
The first columns are % of capacity (survivors, eden, old, metaspace), then counts and seconds for young, full and concurrent GCs. Watch O right after YGC ticks, and hope FGC stays at 0.
JMX MXBeans, which every metrics library reads underneath. java.lang:type=Memory exposes HeapMemoryUsage and NonHeapMemoryUsage, but those are point-in-time and include garbage. The answer to the TRY is MemoryPoolMXBean.getCollectionUsage(): the pool's usage measured right after the last GC.
import java.lang.management.GarbageCollectorMXBean;
import java.lang.management.ManagementFactory;
import java.lang.management.MemoryPoolMXBean;
import java.lang.management.MemoryType;
import java.lang.management.MemoryUsage;

public final class HeapSignals {
    public static void main(String[] args) {
        for (MemoryPoolMXBean pool : ManagementFactory.getMemoryPoolMXBeans()) {
            MemoryUsage afterGc = pool.getCollectionUsage();   // null for non-collected pools
            if (pool.getType() == MemoryType.HEAP && afterGc != null) {
                System.out.printf("%-18s after last GC: %,d MB%n",
                        pool.getName(), afterGc.getUsed() >> 20);   // e.g. "G1 Old Gen"
            }
        }
        for (GarbageCollectorMXBean gc : ManagementFactory.getGarbageCollectorMXBeans()) {
            System.out.printf("%-22s count=%d total=%d ms%n",
                    gc.getName(), gc.getCollectionCount(), gc.getCollectionTime());
        }
    }
}
Notice three things:
G1 Old Genafter GC is the line you'd graph as your live data set.getCollectionTime()is cumulative; take the rate over a window to get GC time %.- With G1 you'll see collector beans named
G1 Young Generation,G1 Old Generation(full GCs only) and, since Java 20,G1 Concurrent GC.
Micrometer (exported to Prometheus and graphed in Grafana) wraps the same beans: jvm.memory.used and jvm.memory.max tagged by area and pool id, the jvm.gc.pause timer (enable histograms for a real p99), jvm.gc.memory.allocated for allocation rate, and JvmHeapPressureMetrics, which adds jvm.memory.usage.after.gc and jvm.gc.overhead. Those last two are the alerting gold.
JFR for depth: jdk.GarbageCollection, jdk.GCHeapSummary and jdk.G1HeapSummary give per-GC before/after numbers, jdk.ObjectAllocationSample shows who allocates, and jdk.OldObjectSample points at objects that survive suspiciously long. We go deep on that in Java Flight Recorder and Mission Control (later in this module).
05Reading a GC log
Logs are the one source that's always there after the fact, so turn them on in every environment. Since Java 9, GC logging uses unified logging:
-Xlog:gc*:file=gc.log:time,uptime,level,tags:filecount=10,filesize=20m
That logs every GC tag with wall time, uptime, level and tags, rotating ten 20 MB files. Here's one young pause with its gc+heap breakdown (4 MB regions):
[2026-10-17T09:14:03.218+0000][12.345s][info][gc,heap] GC(42) Eden regions: 212->0(220)
[2026-10-17T09:14:03.218+0000][12.345s][info][gc,heap] GC(42) Survivor regions: 9->10(28)
[2026-10-17T09:14:03.218+0000][12.345s][info][gc,heap] GC(42) Old regions: 72->73
[2026-10-17T09:14:03.218+0000][12.345s][info][gc,heap] GC(42) Humongous regions: 2->0
[2026-10-17T09:14:03.218+0000][12.345s][info][gc     ] GC(42) Pause Young (Normal) (G1 Evacuation Pause) 1180M->330M(1436M) 11.456ms
Read the last line left to right:
| Field | Meaning |
|---|---|
[2026-10-17T09:14:03.218+0000] |
wall-clock time (time decorator), for lining up with incidents |
[12.345s] |
JVM uptime (uptime), for measuring intervals |
[info][gc] |
level and tag set |
GC(42) |
the 43rd collection; every line of one GC shares this id |
Pause Young (Normal) |
young-only pause. Other variants: (Concurrent Start), (Prepare Mixed), (Mixed) |
(G1 Evacuation Pause) |
the cause: eden filled up |
1180M->330M(1436M) |
heap used before, heap used after, committed heap |
11.456ms |
how long your threads were stopped |
Now do the arithmetic. This GC freed 850 MB in 11 ms. If GC(43) shows up at 14.150s, young GCs run every ~1.8 s, so you're allocating roughly 850 MB / 1.8 s ≈ 470 MB/s, and pauses take 11 / 1,800 ≈ 0.6% of wall time. That's a healthy service. The 330M after-GC number is the one to chart over hours.
Two patterns you'll meet
| Pattern | What the log shows | Likely cause | Next step |
|---|---|---|---|
| Busy but effective | Frequent young GCs, each freeing most of eden; after-GC stays flat | High churn of short-lived objects | Profile allocations, cut them (see Allocation rate and GC pressure (later in this module)) |
| Busy and failing | GCs get more frequent and free less and less; after-GC climbs; mixed GCs barely help | Long-lived growth or a leak | Take a heap dump and find the owner |
The first one costs CPU but won't crash you. The second one ends in a full GC, then an OutOfMemoryError.
Warning signs in the log
(Evacuation Failure)appended to a young pause (older JDKs loggedTo-space exhausted): G1 ran out of free regions to copy survivors into. Objects stay where they are, the pause gets long, and a full GC often follows. Cause: too little headroom or a promotion spike.Pause Full (G1 Compaction Pause): the emergency exit. Any of these on a service means the heap is too small or something is leaking.Pause Full (System.gc())means someone callsSystem.gc().Concurrent Mark Abort: a full GC interrupted marking, which means marking started too late or the old generation is filling faster than it can be marked.Pause Young (Concurrent Start) (G1 Humongous Allocation): humongous objects are triggering cycles. Turn on-Xlog:gc+humongous=debugto see sizes, then either shrink those arrays or raise-XX:G1HeapRegionSizeso they stop counting as humongous.
06When it crashes: the OutOfMemoryError workflow
An OutOfMemoryError is not one problem; it's six, and the message tells you which. Read it before touching any flag.
The OutOfMemoryError message tells you which memory area ran out and which tool to reach for next
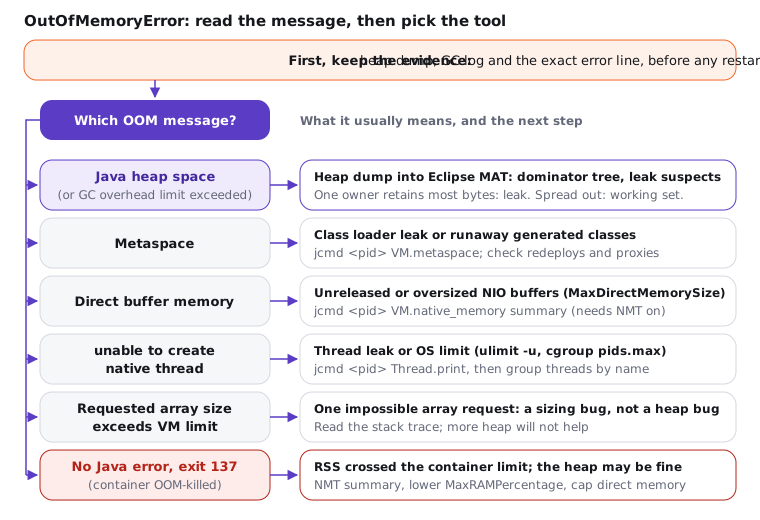
One note on GC overhead limit exceeded (more than 98% of time in GC while recovering under 2% of the heap): it comes mostly from the Parallel collector. With G1 on Java 21, the same situation usually surfaces as Java heap space.
For heap problems, the evidence you need is a heap dump, and you want it captured automatically:
# capture on crash (add to every service)
-XX:+HeapDumpOnOutOfMemoryError -XX:HeapDumpPath=/dumps/ -XX:+ExitOnOutOfMemoryError

# capture on demand from a live JVM (pauses the app while it writes)
jcmd <pid> GC.class_histogram | head -20      # cheap: top classes by bytes
jcmd <pid> GC.heap_dump /dumps/orders-$(date +%s).hprof
HeapDumpOnOutOfMemoryError fires for errors raised by the JVM's own allocator (heap, metaspace). It won't fire for Direct buffer memory, which is thrown from library code. ExitOnOutOfMemoryError makes the JVM exit instead of limping on in an unknown state, so your orchestrator restarts it.
Then open the .hprof in Eclipse MAT:
- Run the Leak Suspects report for a first guess.
- Open the dominator tree, sorted by retained size (memory freed if that object died), not shallow size.
- On the top entry, use Path to GC Roots (excluding weak references) to find who holds it: usually a
staticfield, aThreadLocal, or a listener registry.
If one object (a map, a cache, a queue) retains 60% of the heap, it's a leak. If retained size is spread across ordinary objects, the working set outgrew the heap: raise -Xmx or shrink the data. A cheaper first check is diffing two GC.class_histogram outputs taken an hour apart.
07Code that causes it, and the fix
Try it yourself first
Before reading on, look at PriceCache below and predict how the heap-after-GC line looks after a week in production.
import java.util.HashMap;
import java.util.LinkedHashMap;
import java.util.Map;

record Quote(String sku, long cents) {}

// Leaks: nothing ever leaves the map, and every distinct SKU (or typo'd SKU) stays forever.
final class PriceCache {
    private static final Map<String, Quote> CACHE = new HashMap<>();

    static synchronized Quote get(String sku) {
        return CACHE.computeIfAbsent(sku, PriceCache::load);
    }

    static Quote load(String sku) {
        return new Quote(sku, 1_999);
    }
}

// Bounded: access-ordered LinkedHashMap evicts the least recently used entry.
final class BoundedPriceCache {
    private static final int MAX_ENTRIES = 10_000;

    private final Map<String, Quote> map = new LinkedHashMap<>(16, 0.75f, true) {
        @Override
        protected boolean removeEldestEntry(Map.Entry<String, Quote> eldest) {
            return size() > MAX_ENTRIES;
        }
    };

    synchronized Quote get(String sku) {
        return map.computeIfAbsent(sku, PriceCache::load);
    }
}
The first version draws the bottom chart in Fig. 4: a floor that climbs for days. Notice:
- The leak is the
staticreference: the map is a GC root for as long as the class is loaded, so nothing it holds is ever garbage. - Keys come from user input, so the key space is unbounded.
- The fix bounds the count, and therefore the memory. A cache library with size and time eviction does the same job in real code.
The second classic is the opposite problem: not a leak, but churn.
import java.util.List;

record Line(String sku, int qty, long cents) {}

final class CsvExport {
    // Quadratic copying plus a Formatter per line: each += builds a brand-new String.
    static String slow(List<Line> lines) {
        String out = "";
        for (Line l : lines) {
            out += String.format("%s,%d,%d%n", l.sku(), l.qty(), l.cents());
        }
        return out;
    }

    // One growing buffer, sized up front, no Formatter.
    static String fast(List<Line> lines) {
        StringBuilder sb = new StringBuilder(lines.size() * 32);
        for (Line l : lines) {
            sb.append(l.sku()).append(',').append(l.qty()).append(',').append(l.cents())
              .append(System.lineSeparator());
        }
        return sb.toString();
    }
}
For 10,000 lines, slow copies the growing string 10,000 times (well over 1 GB of garbage for a ~300 KB result); fast allocates a few buffers. That's the "busy but effective" pattern: nothing leaks, but you pay CPU for every byte.
Here's an incident pattern you'll see again and again. A pricing service runs in Kubernetes with a 2 GiB limit and -Xmx2g copied from an old VM config. It never throws OutOfMemoryError. Pods restart every few hours with exit code 137 because heap plus metaspace, 200 thread stacks and Netty's direct buffers cross 2 GiB and the kernel kills the process. The fix is -XX:MaxRAMPercentage=70, -XX:MaxDirectMemorySize=256m, and Native Memory Tracking to confirm RSS settles near 1.7 GiB. Lesson: if there's no Java error, look at RSS, not the heap.
08Alerting without the noise
Raw "heap used above 80%" alerts are the most common bad alert in Java shops. A healthy sawtooth crosses 80% before every young GC, so the alert flaps, gets muted, and is still muted when the real leak arrives. Alert on the floor and on the cost instead:
# heap after GC above 80% of max for 15 minutes (live data set is too close to the ceiling)
jvm_memory_usage_after_gc_percent{area="heap"} > 0.80                    for 15m

# more than 10% of wall time paused in GC over 5 minutes
sum by (instance) (rate(jvm_gc_pause_seconds_sum[5m])) > 0.10            for 10m

# any full GC at all
increase(jvm_gc_pause_seconds_count{action="end of major GC"}[10m]) > 0
Exact metric names vary by Micrometer version, so check yours first. Then put pause p99 next to request latency p99 on the same Grafana panel. If latency spikes line up with GC pauses, you've found your cause; if they don't, stop blaming the GC.
09Advanced: pitfalls, numbers and a production flag set
Many candidates answer "the service is slow" with "increase the heap". That's frequently a mistake. A bigger heap makes young GCs rarer, not shorter (pause time scales with live objects copied, not with eden size), and it makes a leak take longer to crash while making the eventual full GC longer. Find out whether you have churn, a leak or a genuinely larger working set first; only the last one is fixed by -Xmx.
For a G1 service with a 2 to 16 GB heap, I expect young pauses of 5 to 50 ms and allocation rates of 100 MB/s to 1 GB/s; what matters is the trend per request. A full GC on an 8 GB heap typically costs 1 to 5 seconds, even parallel. My default thresholds:
| Signal | Healthy | Investigate |
|---|---|---|
| Heap after GC | flat, under ~60% of max | rising trend, or above 80% for 15 min |
| GC time % | under 3% | above 5 to 10% |
| Young pause p99 | well under MaxGCPauseMillis |
at or over the target |
| Full GCs | 0 | any |
| Allocation rate per request | stable across releases | jumps after a deploy |
Here's the flag set I start with for a containerised Java 21 service. Every flag earns its place:
java \
  -XX:+UseG1GC \
  -XX:InitialRAMPercentage=70 -XX:MaxRAMPercentage=70 \
  -XX:MaxGCPauseMillis=200 \
  -Xlog:gc*:file=/logs/gc.log:time,uptime,level,tags:filecount=10,filesize=20m \
  -XX:+HeapDumpOnOutOfMemoryError -XX:HeapDumpPath=/dumps/ \
  -XX:+ExitOnOutOfMemoryError \
  -XX:NativeMemoryTracking=summary \
  -jar orders.jar
-XX:+UseG1GC documents intent and matters in small containers: with under 2 CPUs or under ~1.8 GB, the JVM silently picks Serial GC. Equal initial and max sizes avoid resizing under load. NativeMemoryTracking=summary costs little and lets jcmd <pid> VM.native_memory summary explain RSS. Make sure /dumps is a volume with room for a heap-sized file.
10How to say it in the interview
When I ask this, I'm listening for three things. First, do you know the heap isn't the whole process (RSS versus -Xmx)? Second, can you explain G1's cycle in your own words, including what makes it fall back to a full GC? Third, and most important, do you go to heap after GC and the OOM message instead of guessing, and do you know the difference between churn and a leak? This is where you can show depth by mentioning getCollectionUsage(), evacuation failures or Eclipse MAT's dominator tree.
In the interview
"The heap is capped by -Xmx, but metaspace, code cache, stacks and direct buffers sit outside it, so in a container I use MaxRAMPercentage around 70. G1 splits the heap into regions: young GCs copy survivors out of eden, concurrent marking starts around 45% occupancy, and mixed GCs clean the old regions with the most garbage, aiming for 200 ms pauses. A full GC means it couldn't keep up, and that's my red flag. To judge health I chart heap after GC: flat is fine, climbing is a leak or a growing working set. Next to it I watch GC time %, allocation rate and pause p99 against request latency. If it crashes, I read the OOM message, take the heap dump and open the dominator tree in Eclipse MAT."
Here's how this might look if you sketch it on the whiteboard:
On the whiteboard
JVM memory + G1
- RSS = heap (-Xmx) + metaspace + code cache + stacks + direct + GC
- defaults: Xms 1/64, Xmx 1/4 of RAM / cgroup; MaxRAMPercentage
- G1: equal regions E / S / O / H (H = obj >= 1/2 region)
- young GC → IHOP 45% → concurrent mark → mixed GCs → young
- goal 200 ms; full GC = fallback (parallel since 10)
- signals: heap after GC, GC %, alloc rate, pause p99, full GC count
- churn: frees a lot → cut allocations; leak: frees less → heap dump
- OOM: read message → dump → MAT dominator tree
Interview questions for this topicComing soon
Further reading (6)
- HotSpot Virtual Machine Garbage Collection Tuning Guide (Java 21): Garbage-First (G1) Garbage Collector
- JEP 248: Make G1 the Default Garbage Collector
- JEP 307: Parallel Full GC for G1
- JEP 439: Generational ZGC
- Java 21 Troubleshooting Guide: Troubleshoot Memory Leaks
- The java command (Java 21): -Xlog and GC options